Determining Traces of Methanol in the Gas Sweetening Process - Updates
By: Dr. Mahmood Moshfeghian
The best way to prevent hydrate formation (and corrosion) is to keep pipelines, tubing and equipment free of liquid water. There are occasions, right or wrong, when the decision is made to operate a line or process containing liquid water. If this decision is made, and the process temperature is below the hydrate point, inhibition of this water is necessary. This is of particular importance in gas gathering systems and subsea operations during normal production as well as during shutdown [1, 2].
Many materials may be added to water to depress both the hydrate and freezing temperatures. For many practical reasons, a thermodynamic hydrate inhibitor such as methanol or one of the glycols is injected. All may be recovered and recirculated, but the economics of methanol recovery may not be favorable in many cases. Hydrate prevention with methanol and or glycols can be quite expensive because of the high effective dosage required (10 to 60 weight % of the water phase). High concentrations of glycols aggravate potential scale problems in the glycol regeneration equipment by lowering the solubility of scaling salts in water and precipitating most known scale inhibitors [2]. The total injection rate of inhibitor required is the amount/concentration of inhibitor in the liquid water phase for the desired hydrate temperature depression, plus the amount of inhibitor that will also distribute in the vapor and liquid hydrocarbon phases. Any inhibitor in the vapor phase or liquid hydrocarbon phase has little effect on hydrate formation conditions.
Solubility loss of MEG in the gas phase is negligible and loss to the liquid hydrocarbon phase is very low. However, methanol losses are more significant, particularly vapor phase losses. The methanol content of vapor and liquid hydrocarbon phases depend on temperature, pressure and composition. Based on the GPA-Midstream RR 149 [3] the methanol content of the gas phase can be as high as 0.075 mole % (750 PPMV) and in the liquid hydrocarbon phase as high as 0.6 mole %. Depending on the solubility losses, chemical makeup requirements for methanol can be very large and expensive for both once-through systems and methanol recovery units.
The significant amount of methanol lost to the hydrocarbon phases may cause problems for refineries, petrochemical, LNG and gas plants downstream as the methanol is not removed in standard gas processing plants. In gas plants where there is propane recovery the methanol will follow the propane product and be a potential cause for propane to go off specification for oxygenates. Methanol has also been known to cause premature failure in molecular sieves due to the methanol cracking / coking on the sieve at regeneration operating conditions. In refineries the methanol must be washed out of the crude/condensate, where it presents a problem in wastewater treatment. In petrochemical plants methanol is also considered poison for certain catalysts. The readers can find more detail in reference [4].
The October 2010 tip of the month (TOTM) considered the presence of methanol in the produced oil/water/gas stream and determined the quantitative traces of methanol ending up in the TEG dehydrated gas [5]. That tip studied the effect of wet gas temperature, the number of theoretical trays in the TEG contactor, the water content specification of dry gas, and lean TEG circulation rate on the dried gas methanol content.
The July 2014 TOTM compared the performance of monoethanolamine (MEA) diethanolamine (DEA) and methydeithanolamine (MDEA) by simulation of a sweetening unit [6]. The H2S and CO2 concentration in the sweet gas, amine solution circulation rate, reboiler duty, amine losses, pump power, and lean-rich heat exchanger duty were calculated and plotted for a wide range of steam rates needed to regenerate the rich solution.
The July 2016 TOTM considered the presence of methanol in the sour gas stream and determined the quantitative traces of methanol ending up in the sweet gas, flash gas and acid gas streams. To achieve this task, the tip simulated a simplified MDEA gas sweetening unit by computer [7, 8]. The July 2016 TOTM also studied the effect of feed sour gas temperature, methanol content, and the rate of replacing condensed reflux with fresh water on the sweet gas methanol content. For the two feed sour gas temperatures of 32.2 and 43.3 °C (90 and 110 °F), the July 2016 TOTM studied three inlet gas methanol contents of 50, 250, and 500 PPMV. In each case the tip varied rate of freshwater replacement from 0 to 100 % by an increment of 20%. The simulated results are presented graphically.
Case Study:
For the purpose of illustration, the July 2016 TOTM considered sweetening of 2.832 x 10⁶ Sm3/d (100 MMscfd) of a sour natural gas using MDEA. Table 1 presents its composition, pressure, and temperature. Used ProMax [9] simulation software with “Amine Sweetening – PR” property package to perform all the simulations.
Table 1. Feed composition, volumetric flow rate and conditions
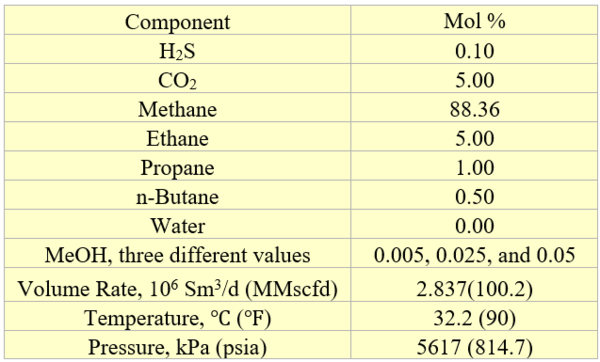
Figure 1 [9] presents a modified sweeting process flow diagram for the case study. A large fraction of methanol entering with the sour gas leaves the sweetening unit via streams 4 (Sweet Gas), 6 (Flash Gas) and 12 (Acid Gas). However, some of the methanol is trapped and accumulates in the system and reaches its highest concentration in stream 10 (reflux). To further lower the methanol concentration in the sweet gas, a fraction of reflux stream is purged via “Water Draw” stream and replaced with “Fresh Water”. Figure 2 presents the magnification of the upper right-hand corner of Figure 1 showing the water draw and freshwater streams.
Modified Case Study:
In this tip we have considered three modifications in the July 2016 TOTM.
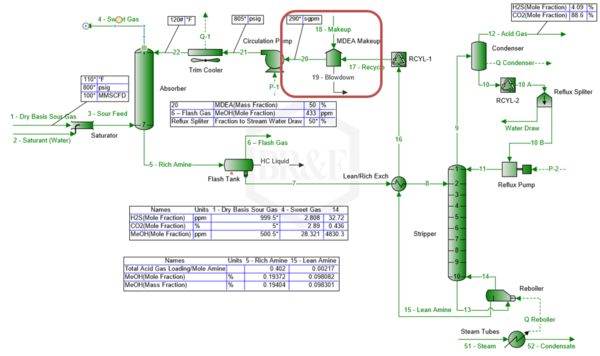
Figure 1. Simplified process flow diagram for an amine sweetening unit [9]
2. In Figure 2 (A. Original water draw and make up), the “Water Draw” stream removes a specified fraction of stream 10A (the condensed reflux) and the “Fresh Water” stream adds the same amount of fresh water to the process. To illustrate the effect of this water replacement on lowering the methanol content of the sweet gas, the fraction of condensed water removed is varied from 0 to 100% with an increment of 20% on the mole basis.
A better alternative is shown in Figure 2 (B. Modified water draw and make up) where the amount of water draw is supplied by the makeup tool of ProMax shown in the top of Figure 1.
3. The effect of feed gas pressure on the methanol removal by amine sweetening process for pressures of 600, 800, and 1000 psig (4200, 5600, and 7000 kPag) was investigated and reported.
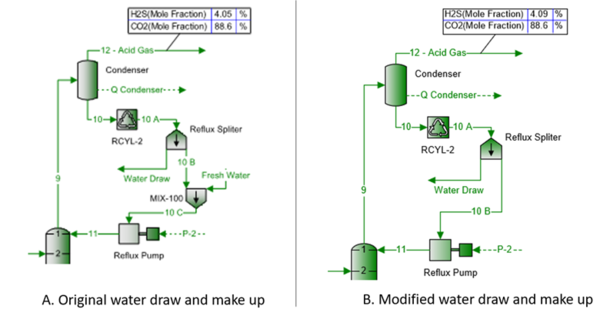
Figure 2. Schematic for water draw replacement of a portion of reflux stream with fresh water
The following specifications/assumptions for the case study are considered:
Contactor Column
a. Feed sour gas is saturated with water
b. Number of theoretical stages = 7
c. Pressure drop = 20 kPa (3 psi)
d. Lean amine solution temperature = Sour gas feed temperature + 5.5 (10 )
Regenerator Column
a. Number of theoretical stages = 10 (excluding condenser and reboiler)
b. Feed rich solution temperature = 98.9 (210 )
c. Feed rich solution pressure = 414 kPa (60 psig)
d. Condenser temperature = 48.9 (120 )
e. Pressure drop = 28 kPa (4 psi)
f. Bottom pressure = 110 kPag (16 psig)
Reboiler duty = 132 kg of steam/m3 of amine solution (1.1 lbm/gallon) times amine circulation rate
Heat Exchangers
a. Lean amine cooler pressure drop = 35 kPa (5 psi)
b. Rich side pressure = 35 kPa (5 psi)
c. Lean side pressure = 35 kPa (5 psi)
Pump
a. Discharge Pressure = Feed sour gas pressure + 35 kPa (5 psi)
b. Efficiency = 65 %
Lean Amine Concentration and Circulation Rate
a. MDEA concentration in lean amine = 50 weight %
b. Standard lean amine circulation rate = 65.87 Sm3/h (290 sgpm)
(This rate resulted in a total gas loading in rich solution of ~0.40 mole acid gases/mole of amine)
Rich Solution Expansion Valve
a. Flash tank pressure = 448 kPag (65 psig)
Results and Discussions:
Based on the description and specifications presented in the previous section, ProMax [9] is used to simulate the process flow diagram in Figure 1. For each simulation run, the following properties are reported:
1. Methanol molar concentration (PPM) in
a. Sweet gas
b. Flash gas from the amine flash tank
c. Acid gas from regenerator
2. Methanol concentration (wt %) in
a. Lean amine
b. Condensed reflux (stream 10)
c. Returned reflux (stream 11)
3. H2S and CO2 concentration in the sweet gas.
The calculated H2S concentrations in the sweet gas were little changed by reflux methanol concentrations. The ranges were 3.53 to 2.22 PPMV and 1.92 to 1.19 PPMV for the sour gas temperatures of 43.3 and 32.2°C (110 and 90°F), respectively. The presence of methanol slightly increases the H2S content of sweet gas. The calculated CO2 concentrations in the sweet gas were 2.89 and 2.61 mole % for feed sour gas temperatures of 43.3 and 32.2°C (110 and 90°F), respectively. Therefore, the presence of methanol practically has no effect on the H2S, and CO2 content in the sweet gas.
The variation of sweet gas methanol content as a function of the molar % of the reflux stream purged with fresh water is presented in Figures 3 through 5 for the sweet gas, flash gas, and acid gas streams, respectively. In all figures, the solid line and filed symbols present 43.3°C (110°F) and dashed lines and empty symbols present 32.2°C (90°F). The square, circle, and triangle symbols present the sour gas methanol content of 50, 250, and 500 PPMV, respectively.
Figure 3 presents the variation of the methanol content in the sweet gas stream as a function of the reflux rate replacement with fresh water for the two feed sour gas temperatures and three methanol contents (PPM) in the feed sour gas stream. The two temperatures are 43.3 and 32.2 °C (110 and 90 °F) and the three methanol contents of feed sour gas are 50, 250, and 500 PPMV. In Figures 3 through 8, PPM A and PPM B represent 43.3 and 32.2 °C (110 and 90 °F), respectively.
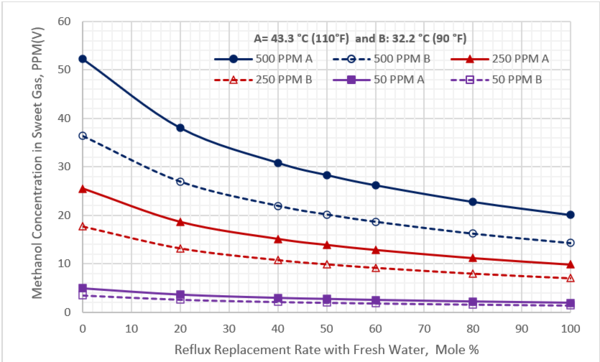
Figure 3. Methanol content in the sweet gas stream vs reflux rate replacement
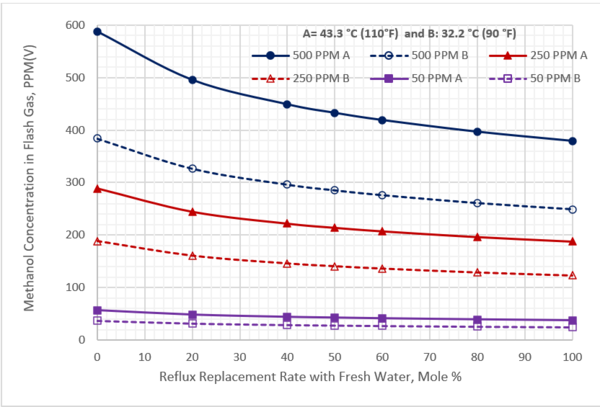
Figure 4. Methanol content in the flash gas stream vs reflux rate replacement
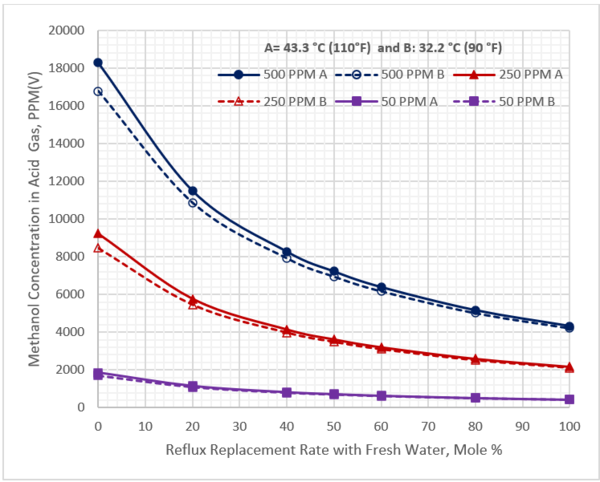
Figure 5. Methanol content in the acid gas stream vs reflux rate replacement
Figure 3 indicates that as the percent of purging the reflux stream with freshwater increases, the methanol content of sweet gas decreases. For 100% purging, the maximum methanol reduction is ~62% for the case of 43.3°C (110°F) and 500 PPMV and the minimum is ~60% for the case of 32.2°C (90°F) and 50 PPMV and.
Figure 4 presents a similar trend for methanol content in the flash gas stream. For 100% purging, the maximum methanol reduction is ~34% for the case of 43.3°C (110°F) and 500 PPMV and the minimum is ~34% for the case of 32.2°C (90°F) and 50 PPMV.
Figure 5 presents a different trend for methanol content in the acid gas stream. This figure indicates that the sour gas feed temperature has practically no effect on the acid gas stream methanol content. For 100% purging, the methanol content reductions were in the range of ~76% to ~75% for all cases of feed sour gas temperatures and methanol contents. The feed sour gas pressure is 800 psig (5600 kPag) for Figures 3 through 8.
The variation of the methanol content as a function of the molar % of the reflux stream replaced with fresh water is presented in Figures 6 through 8 for the lean amine, purged reflux, and replaced reflux streams, respectively. In these three figures the effect of the feed sour gas temperature is practically negligible.
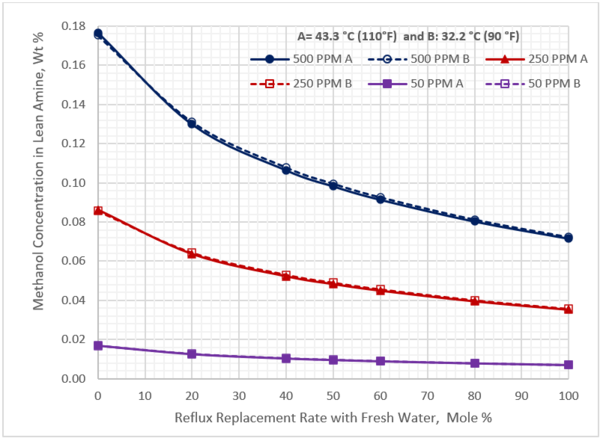
Figure 6. Methanol content in the lean amine stream vs reflux rate replacement
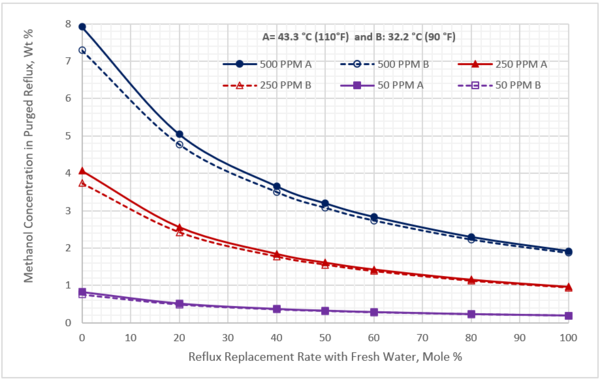
Figure 7. Methanol content in the purged reflux stream vs reflux rate replacement
Figure 6 indicates that as the reflux stream purging with freshwater increases, the methanol content of the lean amine decreases. For 100% purging, the maximum methanol reduction is ~59% for the case of 43.3°C (110°F) and 500 PPMV and the minimum is ~58% for the case of 32.2°C (90°F) and 50 PPMV and. These values are the same as those reported for the methanol content in the sweet gas. This is expected because the lean amine stream and sweet gas stream streams are in equilibrium with each other.
Figure 7 presents a similar trend for methanol content in the purged reflux stream. For 100% purging, the minimum reduction of methanol is ~74.8% for the case of 32.2°C (90°F) and 500 PPMV and maximum is ~76.6% for the case of 43.3°C (110°F) and 50 PPMV.
Figure 8 presents a different trend for methanol content in the acid gas stream. For 100% purging, the reduction of methanol content is 100% for both temperatures and the three methanol contents in feed sour gas.
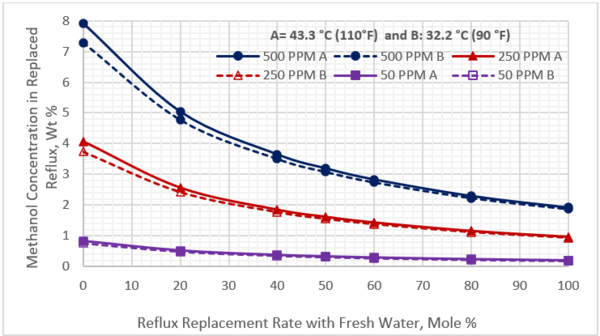
Figure 8. Methanol content in the replaced reflux stream vs reflux rate replacement
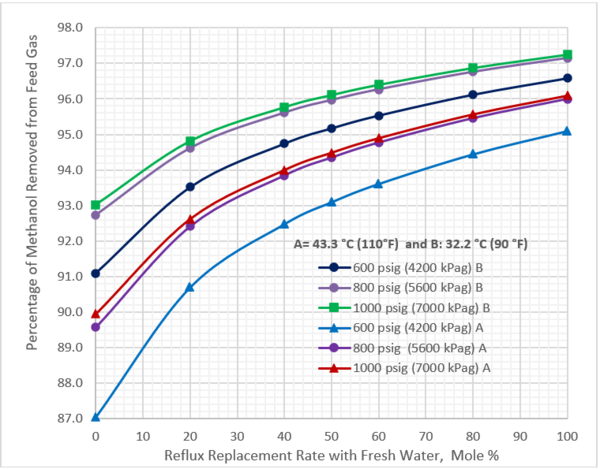
Figure 9. Percentage of methanol removed from feed sour gas versus reflux replacement with fresh water for different sour gas pressures and temperatures (500 PPMV Methanol in Feed Sour Gas)
Figure 9 shows the effect of feed sour gas pressure, temperature, and reflux replacement with fresh water on the percentage of methanol removed from feed sour gas (500 PPMV Methanol in Feed Sour Gas)
Table 2a indicates that both TOTMs for the basic MDEA sweetening process (0% reflux rate replacement) and for the feed sour gas pressure of 800 psig (5600 kPag) and temperature of 32.2°C (90°F) regardless of methanol concentration in the feed gas, reduced the sweet gas methanol content (PPMV) by ~92 to 93%, but for 100% reflux rate replacement, methanol removal efficiency is ~94.7% by Jul 2016 TOTM and 97.2 % by Oct 2022 TOTM.
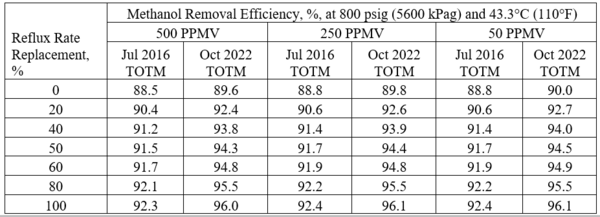
Similarly, Table 2b indicates that both TOTMs for the basic MDEA sweetening process (0% reflux rate replacement) and for the feed sour gas pressure of 800 psig (5600 kPag) and temperature of 43.3°C (110°F) regardless of methanol concentration in the feed gas, reduced the sweet gas methanol content (PPMV) by ~88.5 to 90%, but for 100% reflux rate replacement, methanol removal efficiency is ~92.3% by Jul 2016 TOTM and 96.1 % by Oct 2022 TOTM.
Table 2a-Comparison of the methanol removal efficiencies between Jul 2016 & Oct 2022 TOTM
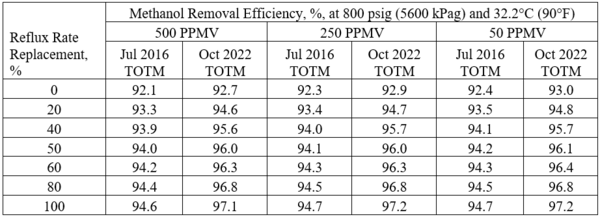
Table 2b-Comparison of the methanol removal efficiencies between Jul 2016 & Oct 2022 TOT
Conclusions:
Based on the results obtained for the considered modified case study, this TOTM presents the following conclusions:
1. By selecting ProMax [9] simulation software with “Amine Sweetening – Polar PR” instead of “Amine Sweetening – PR” property package and adding makeup water through stream 18 in Makeup tool at the top of Figure 1, methanol removal efficiency increased noticeably
2. The MDEA sweetening process removes a considerable amount of methanol from feed sour gas (Fig 9). Moreover, if the methanol content of the sour gas is high, the sweetened gas may still retain high methanol content and can cause operational troubles in the downstream processes.
3. The highest concentration of methanol content due to entrapment of methanol in the system is in the condensed reflux stream 10 (Fig 7).
a) Provisions of purging reflux (Water Draw) and its replacement with “Fresh Water” (Figures 1 and 2 B. Modified) make up tool of ProMax [9] can improve methanol recovery.
4. Figure 9 indicates that the basic MDEA sweetening process reduced the sweet gas methanol content (PPMV) at 800 psig (5600 kPag) by ~89.5% and ~92.5% for the cases of 43.3°C (110°F) and 32.2°C (90°F), respectively (Stream 4 in Figure 1).
5. Figure 9 also indicates that the modified MDEA sweetening process with 100% purging of the reflux stream reduced the sweet gas methanol content (PPMV) at 800 psig (5600 kPag) by ~95% and ~97% for the cases of 43.3°C (110°F) and 32.2°C (90°F), respectively (Stream 4 in Figure 1).
6. The purged reflux stream, which contains methanol should be disposed of properly or it may be treated within the plant. The treated recovered water may be reused as fresh water in the sweetening process.
Methanol is both a Hazardous Air Pollutant (HAP) and a Volatile Organic Compound (VOC). It is regulated by the US EPA under the Clean Air Act. Operators therefore need to make sure that it is disposed of properly when purged. However, they must also consider its release into the atmosphere. This means that if there is no sulfur present, the acid gas likely cannot be vented without exceeding HAP/VOC thresholds. It must be sent to a control device, and even there, depending on the size of the plant, the operator may still bump into threshold limits.
To learn more about similar cases and how to minimize operational troubles, we suggest attending our G6 (Gas Treating and Sulfur Recovery), G4 (Gas Conditioning and Processing), and PF4 (Oil Production and Processing Facilities) courses.
By: Dr. Mahmood Moshfeghian
References:
1. Bullin, K.A., Bullin, J.A., “Optimizing methanol usage for hydrate inhibition in a gas gathering system,” Presented at the 83rd Annual GPA Convention - March 15, 2004.
2. Szymczak, S., Sanders, K., Pakulski, M., Higgins, T.; “Chemical Compromise: A Thermodynamic and Low-Dose Hydrate-Inhibitor Solution for Hydrate Control in the Gulf of Mexico,” SPE Projects, Facilities & Construction, Dec 2006.
3. Gas Processors Association, "GPA RR-149: Vapor-Liquid and Vapor-Liquid-Liquid
Equilibrium for H2S, CO2, Selected Light Hydrocarbons and a Gas Condensate in Aqueous Methanol or Ethylene Glycol Solutions," 1995.
4. O’Brien, D., Mejorada, J., Addington, L., “Adjusting Gas Treatment Strategies to Resolve Methanol Issues,” Proceedings of Lawrence Reid Gas Conditioning Conference, Norman, Oklahoma, 2016.
5. Moshfeghian, M., October 2010 tip of the month, PetroSkills – John M. Campbell, 2010.
6. Moshfeghian, M., July 2014 tip of the month, PetroSkills – John M. Campbell, 2014
7. Maddox, R.N., and Morgan, D.J., Gas Conditioning and Processing, Volume 4: Gas treating and sulfur Recovery, Campbell Petroleum Series, Norman, Oklahoma, 1998.
8. Campbell, J.M., Gas Conditioning and Processing, Volume 2: The Equipment Modules, 9th Edition, 1st Printing, Editors Hubbard, R. and Snow –McGregor, K., Campbell Petroleum Series, Norman, Oklahoma, 2014.
9. ProMax 5.0, Bryan Research and Engineering, Inc., Bryan, Texas, 2020.