The Long Road Ahead; Opportunities and Challenges in U.S. LNG Export Development
Author: Kindra Snow-McGregor, P.E.
Introduction
After an extended period of low U.S. benchmark Henry Hub natural gas prices, many gas producers would welcome build-out of U.S. LNG export facilities. The global demand for U.S. sourced LNG remains strong, and Henry Hub indexed LNG is very competitive globally. LNG exports are expected to be the largest driver for lower 48 demand growth over the next 5 years. We have demonstrated the capability to execute these projects successfully and quickly. With the first LNG exports in 2016, the US has become one of worlds’ three largest LNG exporters along with Qatar and Australia [1]. Currently there are seven US export facilities in operation, six under construction, and eleven proposed.
There is intense competition between developers to bring these proposed liquefaction projects online. Securing long-term 20-year off-take contracts is required prior to the final investment decision (FID) due to the significant amount of capital required. Many European buyers hesitate to lock in multi-decade contracts that developers need to secure project financing. This is because their countries’ goals to meet net-zero by 2050 directly conflict with a secure, affordable supply of LNG feed-gas. Financiers have been encouraged to question the viability of long-term natural gas infrastructure as the industrialized world attempts to rapidly decarbonize.
What are the primary challenges that these projects face, and what will it mean to the U.S. natural gas consumers if they all do come online? This TOTM provides a discussion and analysis to several pertinent questions.
Current, Under Construction and Proposed U.S. LNG Export Capacity in the Lower 48 States
The current liquefaction capacity in the U.S. is summarized in Table 1 below.
Table 1. Current U.S. LNG Export Facilities
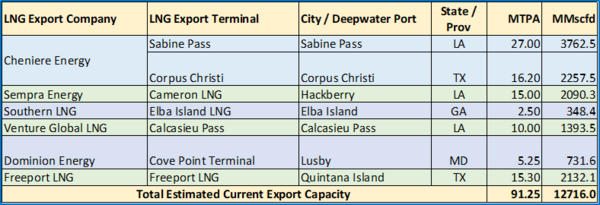
The name-plate capacity values in Table 1 came from the individual project websites, and other publicly available information. The gas flow rate conversion assumed a pipeline natural gas with a relative density of ~0.58. Depending upon the actual gas compositions, the gas flowrates will vary, but this gives a good estimate of volumetric flows. To put these numbers into perspective it takes roughly 140 MMscfd to produce 1 MTPA of LNG. That would be sufficient to produce approximately 930 MW in a combined-cycle power plant (assumed:15 MMscfd per 100 MW generated). Note that current U.S. export capacity is roughly 12.7 billion standard cubic feet per day (bscf/d). That is a significant amount of energy that the U.S. is providing to allies over-seas to help them secure their energy security.
There are several facilities in construction, both expansion and new projects. These are summarized in Table 2 below.
Table 2. Lower-48 LNG Export Projects Under Construction

The additional liquefaction capacity that is currently under construction is roughly 9.2 bscf/d. When completed, these projects will increase the current liquefaction capacity by over 70% , to roughly 157 MTPA, or 21.9 billion cubic feet per day, ramping up in 2024 with likely all projects producing at a commercial scale by 2028.
The number of LNG export projects that are currently being planned, but are pre-FID, are listed in Table 3.
Table 3. Planned Pre-FID LNG Facilities
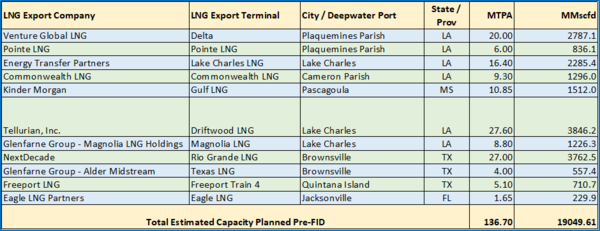
The current U.S. expansion of LNG liquefaction capacity is staggering. It will nearly double capacity in 2028 after all the facilities currently under construction come on-line. The rapid growth of LNG both under construction and proposed is summarized in Table 4.
Table 4. U.S. Liquefaction Capacity – Now, Future and Proposed
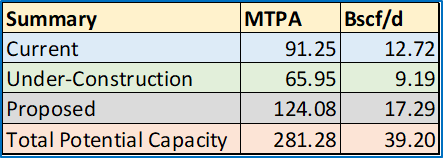
Our total export capacity would be roughly 281 MTPA, or ~ 39 bscf/d. The U.S. would become the dominant LNG exporter in the world, as shown in Figure 1 below.
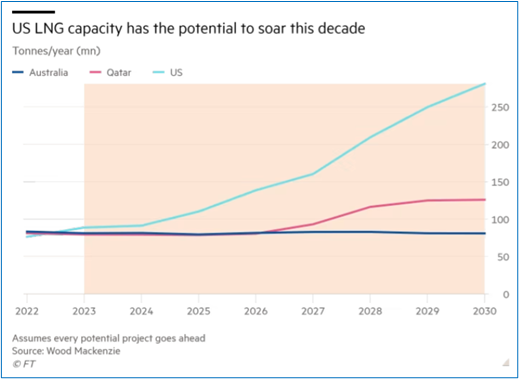
Figure 1. Potential US LNG Capacity, [2]
Can the U.S. natural gas production support all these LNG projects, and if so with what consequences to the Henry Hub pricing?
That is a significant amount of gas being proposed for export. LNG exports will be the biggest driver of growth for natural gas in the lower 48 States. How does this demand compare to the current U.S. natural gas production?
According to the U.S. Energy Information Administration, the monthly average in February 2023 was 101.5 bscf/d. This production is 19% higher than the previous five-year average [3]. Today the Henry Hub price has been very low, hovering around $2/MMBtu since January 2023. That is largely a result of very high natural gas storage inventories (36% over last year, and 23% higher than our 5-year average). This winter, natural gas storage withdrawals have been less than “typical” and currently there are 25 more rigs operating than at the same time last year [4]. Those factors have largely contributed to the low gas price (more supply than the demand requires).
Table 5 provides a comparison of current, under construction, and proposed liquefaction capacity with the current U.S. gas production rates. Note, the table assumes all plants under construction are on-line and at capacity in the year 2028. The proposed liquefaction plants are assumed to be on-line and at capacity in the year 2029. An assumed underlying 2.3% annual natural gas production rate is included to estimate “possible” gas production using the 5-year average annual growth from the Statistical Review of World Energy 2022 [5].
Table 5. Comparison of Liquefaction Capacity to Gas Production through 2029
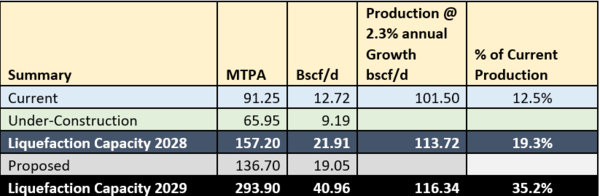
By the end of year 2028, the liquefaction capacity in the U.S. will be roughly 20% of the total gas production. It should be noted that the U.S. is the world’s largest gas producer AND gas consumer in the world. Our average annual gas consumption over the five years 2017 – 2021 has been roughly 94% of the total gas produced. But specifically in 2021, it was down to 88% reflecting primarily LNG exports [5].
The May 2023 Short-Term Energy Outlook (STEO) from the EIA [3] is forecasting an increase in Henry Hub prices to roughly $4/MMBtu in 2024 because of increasing demand for electricity generation and increases in LNG exports; furthermore, they are projecting a decline in dry natural gas production. In 2024, there is the potential for Plaquemines LNG, and the Golden Pass LNG facilities to come on-line. Granted, it takes time to get up to commercial capacity, but for discussion purposes, those two projects add an additional 4.4 bscf/d demand on dry gas production to 17%. With the current regulatory environment, and this administration’s desire to limit and reduce U.S. hydrocarbon production, these projects will likely put significant upward pressure on Henry Hub gas pricing as the supply might not be able to meet this demand.
Are there adequate pipeline capacity and expansion projects to ensure the required volumes of feed gas can be delivered when these LNG plants are scheduled to come on-line?
The majority of the new LNG export projects are in Texas and Louisiana, as shown in Figure 2. The export capacities will help balance the market and support prices in 2024. It is possible that beyond 2023, the increased export volumes will result in tighter natural gas supply balances and price spikes. Pipeline expansions will be required to support these export facilities’ feed-gas requirements.
There are multiple pipeline projects currently being planned, but timing will prove to be everything. If the liquefaction plants come on-line before the pipeline capacity becomes available then the exports may be delayed, or it could create a gas shortage in the Gulf Coast. Conversely, if the pipeline projects are completed prior to the liquefaction plants, that would result in excess supply in the Gulf Coast. The pipeline projects that will be serving these facilities fall into two categories:
- Main gas supply lines from the Haynesville Shale and other supply basins
- Pipelines that connect the LNG export facility to the main larger supply lines.
Fortunately, these projects are within “hydrocarbon” friendly states of Texas and Louisiana. However, pipeline projects have been increasingly difficult to permit and construct in the current regulatory environment. In addition, the supply basin will need the ability to continue drilling to provide a reliable supply. Again, this has proven increasingly more difficult as the current administration tries to meet their net-zero renewable energy goals. This is in direct conflict of their significant support to expand U.S. LNG export facilities to help Europe secure energy supplies. New and expanded pipeline capacity is another layer of project complexity, and market risk, that the LNG export plants both under construction and proposed face.
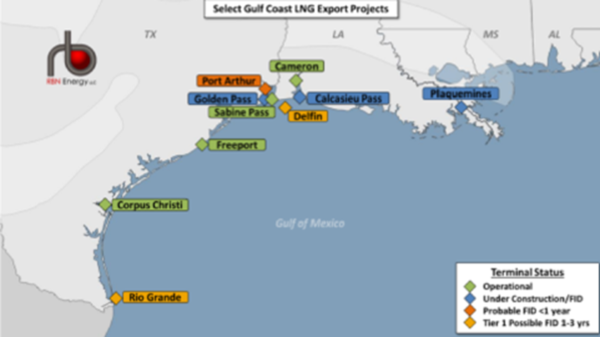
Figure 2. Operational, Under-Construction /FID, Probable and Possible Tier 1 LNG Projects in Texas, and Louisiana [6]
Source: RBN LNG Voyager (https;//rbnenergy.com/products/lng=voyager)
What other challenges are these projects facing due to inflation, higher interest rates, and supply chain constraints?
It is unlikely that all the proposed LNG projects will make it past the finish line because of skyrocketing development costs due to inflation, higher cost of lending and other supply chain constraints. As mentioned previously, these are massive investments requiring long-term supply contracts to secure funding. Figure 3 provides a rough estimate of the significant increase in costs that the industry is experiencing in these mega-projects. To put this into perspective, Calcasieu Pass LNG costs increased from ~$590/tonne of LNG at FID to ~$675/tonne at the end of the project [2]. At 10 MTPA plant capacity, the total installed cost of the facility would be roughly $6.75 billion dollars.
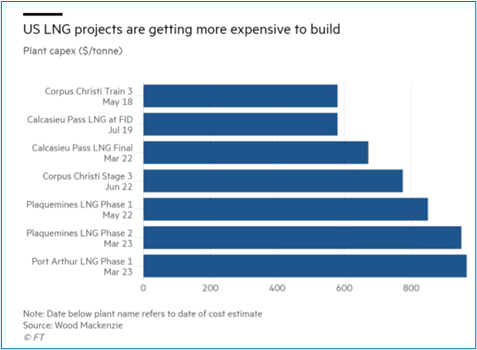
Figure 3. Significant Increase in Costs to Build U.S. LNG Facilities [2]
The projects that have not made FID will have to manage supply-chain inflation pushing up construction costs, compounded with higher interest rates increasing the financing costs. It is likely many of these projects will therefore have to renegotiate long-term (20+ years) offtake agreements, which will contribute to further project delays. Another challenge is that most European buyers are hesitant to lock in multi-decade contracts that the developers need to secure the financing for their projects. Adding to the difficulties, investors and financiers are becoming more resistant to financing long-term oil and gas projects due to Environmental, Social and Governance (ESG) concerns.
Which projects could potentially be negatively impacted because of the new Department of Energy (DOE) rule change announced April 21?
The Department of Energy (DOE) April 21st announcement revised the department’s policy on authorizing exports to non-Free Trade Agreement (non-FTA) countries [7]. The authorizations currently allowed 7 years between, granting of approval of the non-FTA export license, and the facilities’ start of exports. In the past, license extensions were easily renewed. With the new policy rule, if the company reaches the 7-year deadline and has not begun construction and cannot demonstrate that its lack of work was out of the company’s control, it’s non-FTA license will expire. The company can submit a new non-FTA application but would be starting a new application and would be in the back-of-the-line of applicants currently in the queue.
The reasoning behind the new rule is that more than half of the volume of gas approved for non-FTA export licenses is held by LNG projects that are not operating nor under construction. Energy Transfer’s request for an export license extension for the Lake Charles LNG project was denied by the DOE this past May. It was the third extension request [8]. Currently Lake Charles LNG has roughly 8.1 MTPA long-term offtake agreements, which is likely insufficient to secure the financing of a 16.4 MTPA facility. Often a minimum of 75% of the plant capacity secured in long-term agreements is required to make FID.
With the new rule in place, which proposed projects are likely at risk of losing their non-FTA export license agreements? There are two extensions that are still under consideration: Magnolia LNG, and Pierdae LNG (Canada). Magnolia LNG requested a 29-month extension until April 2026. Magnolia LNG was originally targeting 2023 for FID, it remains to be seen if that still occurs [9]. Table 6 provides a summary of proposed Pre-FID LNG projects that may require an extension [10].
Table 6. Proposed Pre-FID LNG Projects at Risk of Requiring and Extension [10]
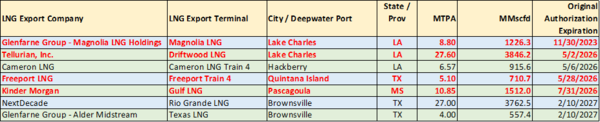
All the projects on this list are at some risk of requiring an extension. The projects that expire prior to 2026 (in red) would require that they be under construction now to meet the expiration deadlines. The Driftwood LNG project was included in the high-risk list simply because of the number of challenges the project has faced thus far with financing and contracts to date. Rio Grande LNG is likely to make FID soon and has contracted an EPC contractor for the project. It is difficult to say what will happen with Texas LNG. Originally, they were planning on making FID in 2022 but that announcement has not been made to date [9].
Starting construction without a valid export license would be a significant risk as it remains to be seen what the DOE would accept as an “extenuating circumstance” under their new rule. It could be possible that a few of these projects decide to reapply for a new export license to mitigate the risk of being near complete construction and losing their export license and being forced to reapply at that time.
Conclusion:
After the U.S. shale-gas revolution made us the largest natural gas producer (and notably consumer) in the world, there has been a significant push to export pipeline gas. This is largely driven to the arbitrage that sellers can make selling affordable “cheap” Henry Hub natural gas internationally where the natural gas prices as significantly higher.
Given the rapid expansion of LNG in the U.S. gulf coast, it is likely that we will see natural gas supply constraints and upward pressure on the price of natural gas in the lower 48. Many currently proposed projects may not make it to the finish line, given the now challenging environment for mega-scale fossil fuel investments. Not only are there regulatory hurdles, but those are being compounded by securing an adequate feed-gas supply, negotiating long-term take-off agreements for project financing, compounded by rapidly increasing project costs.
To learn more about LNG, we suggest attending our G2 (Overview of Gas Conditioning and Processing), G4LNG (Gas Conditioning and Processing, LNG Emphasis), G29 (LNG Short Course: Technology and the LNG Value Chain), or OT-43 (Advanced LNG Operator Training) courses.
By: Kindra Snow-McGregor, P.E.
References:
- “U.S. becomes top LNG exporter in first half of 2022 – EIA”, Reuters, July 25, 2022.
- “Rising costs and competition threaten US boom in LNG projects”, McCormick, M., financial Times, 4/17/23.
- “U.S. Henry Hub natural gas price expected to increase from recent lows”, Today in Energy, EIA, 5/16/23.
- “Why Are U.S. Natural Gas Futures So Low?”, Hecht, A., Barchart, 3/29/23.
- Statistical Review of World Energy 2022 © BP p.l.c. 2022
- “Gotta Get Over – The Race to Debottleneck U.S. LNG Feedgas Routes”, Sheetal Nasta, RBN Energy LLC, 2/26/23.
- “DOE tightens policy on extensions for LNG Export approvals”, Kovski, A., Oil&Gas Journal, 4/25/23.
- “Energy Transfer Fumes over DOE Rejection”, Sultan, M., Energy Intelligence, 5/11/23.
- U.S.LiquefactionCapacity.xlsx, https://www.eia.gov/naturalgas/data.php#imports
- “Life in the Fast Lane – New DOE Rule Changes Push LNG Projects to Move Fast or Get Left Behind”, Schneider, L., RBN Energy LLC, 5/16/23.