The August 2019 Tip of The Month, “A Primer on LNG – What is it, Where does it fit, and The New Kid on the Block “[1] provided a high level summary of the history of LNG, from the maiden voyage of the Methane Pioneer, to the current world trade statistics for 2017 [2]. BP recently published the international LNG trade statistics for 2018 in their Statistical Review of World Energy 2019. In 2018, the international LNG trade was reported to be 431 billion cubic meters per year (BCM/yr), roughly 15.2 trillion cubic feet per year, which converts to 319 mtpa (million tonnes LNG per annum) [3]. In 2018, 20 Nations provided LNG for Export, with 42 Nations receiving the LNG at their Import Terminals [4]. The 2018 exports from the USA totaled some 28.4 BCM/yr (1 trillion cubic feet/yr) corresponding to roughly 21 mtpa [3]. This tonnage related to an average daily natural gas liquefaction rate of approximately 2.75 billion cubic feet per day (Bcfd) produced from three (3) plants, namely Sabine Pass, Corpus Christi, and Cove Point LNG. The location of these facilities are shown in Figure 1 [5]. It should be noted that the Kenai, Alaska LNG facility was not operational during this period.
As a result of the increased US LNG production, the USA rose to the fourth-largest LNG exporter in the world, following Qatar (1), Australia (2), and Malaysia (3). [3]. Only three years prior, in 2015, the U.S. did not rank as an LNG exporter (0.7 mtpa) to put the rapid growth in U.S. liquefaction capacity into perspective.
There are many published “approximate” conversions of natural gas to LNG, where simplifying assumptions that can be made to estimate “rough” numbers as presented above. These conversions are based on the approximate conversion factors as published by BP. These conversion factors are summarized in Table 1 [3].
Table 1
Approximate Natural Gas and LNG Conversions [3]
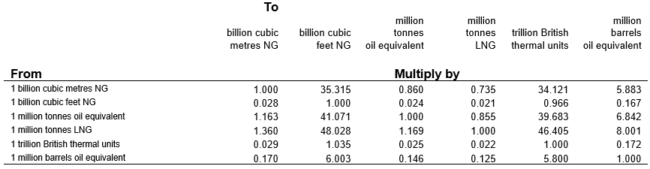
If one requires a firm understanding of their specific LNG plant operations, more detailed calculations are required for accurate results. A brief review of these common conversions and their consequences will be discussed.

Figure 1. Existing USA LNG Export Facilities [5]
Summary of Common Natural Gas to LNG Conversions
A commonly accepted and referenced value of the decrease in volume of natural gas to LNG is roughly 600:1. This could be in the units of std m3 natural gas / m3 or conversely, scf natural gas to ft3 LNG. In reality, this conversion ratio is a function of two important variables:
1) Natural Gas Molecular weight (MW) in kg/kmol [lbm/lbmol]
2) Cryogenic LNG density at – 160 ºC (-260 ºF) and 101 kPa (14.7 psia) in kg/m3 [lbm/ft3]
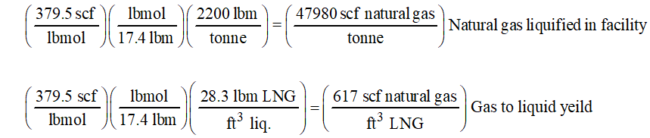
Let’s review the calculations in detail to understand how the gas MW in kg/kmol [lbm/lbmol] and LNG liquid density change the calculated volume ratio for an operating LNG facility. The base conversions are shown below:
SI Solution:

FPS Solution:

As an example, consider a natural gas (LNG) stream with MW = 17.4 kg/kmol (lb/lbmol). Assume the LNG relative density has been determined as 0.453. The relative density of a liquid is defined as the density of the liquid relative to water at standard conditions:

The LNG cryogenic liquid density is then equivalent to 453 kg/m3 (28.27 lbm/ft3). The conversions provided above then result in:
SI Solution:
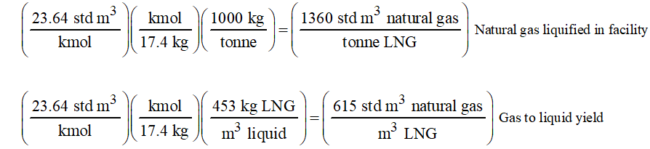
FPS Solution:
For these types of conversions to be accurate, the cryogenic LNG density must be known. A proper Equation of State (EOS) that is designed to incorporate the non-ideal behavior of hydrocarbon liquids at cryogenic conditions must be used. As shown by Figure 2, the conversion of a typical candidate LNG feed stream, yields values in m3 std/tonne (scf/tonne) as a function solely of the feed gas MW.
It should be noted that the natural gas must be the actual “process gas” stream to the liquefaction facility and not the inlet gas to the plant, which goes through pre-conditioning to remove contaminants and heavier hydrocarbons. Figure 3 presents the values for a typical LNG cryogenic density (-160 °C / -260 °F) and atmospheric pressure [6]. Notice that this density is by no means the reported “specific gravity” in many engineering data reference manuals for methane at standard conditions which is 300 kg/m3 (18.72 lb/ft3) [7]. This value reflects the partial density of methane in a liquid state at standard conditions when in the presence of other liquefiable hydrocarbon components, with compositions ranging from rich to lean as discussed in the July 2019 TOTM [1]. Figure 4, provides a graphical solution to determine feed gas at standard conditions std m3 (scf) to the corresponding standard LNG liquid in m3 (ft3).
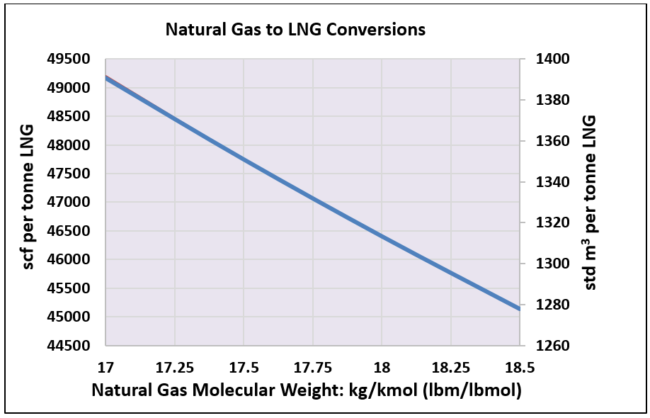
Figure 2. Natural Gas to LNG Conversions as a function of MW
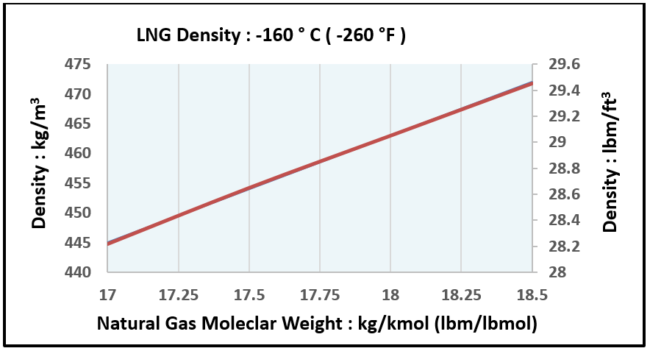
Figure 3. LNG Cryogenic Density: (calculated from PS/JMC GCAP -SRK EOS ) [5]
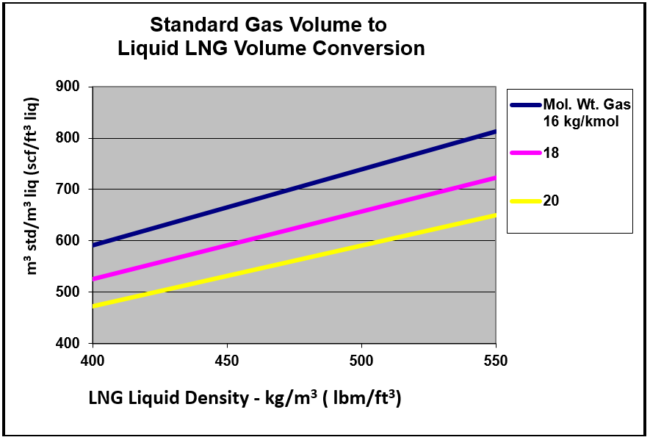
Figure 4. Natural Gas Standard Condition Volume to LNG Volume
The Impact of Conversion Procedures for Natural Gas Standard Volumes to LNG Volumes
As can be observed, there is a difference based on the actual natural gas to LNG “Standard Volume to LNG Volume” based on the gas and LNG physical properties. The plant operator/engineer, should be aware of these subtle differences. For example, if some 10 000 tonnes/d of a natural gas process stream were to be converted to LNG with properties shown above applying 600 std m3 gas /m3 LNG versus the actual 615 std m3/m3 the liquid LNG results daily yield would be: (note: tonne = 2200 lb)

Any contractual commitment based on a global relationship of gas standard volume to LNG volume should be verified by actual in-plant analysis for proper management of the sale of equivalent LNG “Energy”. Note, a 3% difference between the two may seem insignificant, but when you consider the volumes the facilities are liquefying, 3% on say 2.75 billion standard cubic feet per day, is roughly 82 MMscfd. For detailed engineering work, and custody transfer allocations round off errors cannot be tolerated.
LNG Parity to Crude Oil
Another interesting concept for LNG processing and subsequent export is the computation of the actual sale value of the product relative to other commonly traded fuels. Natural gas and LNG are generally traded in terms of $/MMBtu or $/TJ. Considering that LNG is sold on an “energy” basis value, one can determine an “EQUIVALENT LNG“ sales price based on the on the variable price for a bbl of crude oil.
The average closing prices for crude oil in 2018 was $65/bbl [8]. A reasonable heating value for most hydrocarbons (either gas or liquid) can be assumed to be approximately 45 MJ/kg (19,500 BTU/lbm). If we assume a 300 lbm/STB (API = 33.6) oil sample with a specific gravity = 0.857, then the value of a bbl of oil in $/MMBTU is shown below:

Figure 5 [9], provides the market price of LNG quoted in $/MMBTU for the Japan Cleared Customs (JCC), Korea LNG< and Japan Korea Marker (JKM) from 2013 – 2019. Historically the Japanese and Korean LNG supply contracts have been based on a “crude oil” cocktail pricing method – i.e., the price of LNG is indexed to the value of crude oil. The “average” JCC price for LNG in 2018 was roughly $10/MMBTU [10]. The JKM reflects pricing for “spot” trades, and as can be seen in the figure, is significantly more volatile than the long-term contract pricing. Figure 6 [11] shows multiple deliveries of LNG throughout the world within 73% of the value of crude oil during the majority of this timeframe. This figure represents the “spot” trading price of LNG, not the negotiated long-term contracts between individual suppliers and consumers. For 2018, assuming an average value of $10/MMBTU, the value of LNG per tonne is calculated as follows:

What Is the Cargo Value of a Typical LNG Carrier??
If a typical LNG MOSS type carrier is assumed to be loaded at port for export with some 65,000 tons, or approximately 140,000 m3 capacity the average 2018 value on board was:

The above analysis implies the MOSS LNG carrier is transporting roughly 88.4 million std m3 (3.1 Bcf), or approximately 3.1 trillion BTUs. A typical LNG MEMBRANE type carrier will accommodate some 170,000 m3, or approximately 21 % additional cargo and value.

Figure 5. Asian Import Prices for LNG 2013 – 2019 [9]

Figure 6. Global Spot LNG Market Prices $/MMBTU: Through May, 2018 [11]
“Parity Pricing” Divergence Between Crude Oil and LNG in 2019
The very unfortunate state of LNG worldwide affairs beginning in late 2018 has been a noted downturn in the “Parity Pricing” of LNG vis a vis Crude Oil prices. In 2019, the crude oil market is maintaining prices in the ranges of 60-75 $/Bbl, refer to Figure 7 [12]. World LNG sales during this time reflected a parity closer to a 50 $/Bbl crude. Figure 8 [13] shows the integrated “Parity Pricing” of LNG vs. Crude Oil for this period. A useful parity index is the UK NBP (National Balancing Point Price) pricing index that equates energy sales based on the world’s major currencies, as shown by Figure 8. As can be observed by the existing LNG NBP for January 2019 was fixed at some 7.50 $ /MMBTU with the Crude Oil Parity just under 11 $/MMBTU.
At the end of January 2019, however, and with less than one year’s difference, the landed value of spot market trade LNG is at an average of just above 4 $/MMBTU as shown by Figure 9 [14]. This Figure shows an extension of Figure 6, marking the further decrease in LNG prices from 6.50 $/MMBTU from the beginning of 2019. The spot market sales scenario has diminished significantly since 2018!! The situation is rather troublesome for any and all world exporters of the LNG energy commodity relying their trade on the spot market, and only time will tell if and/or when the imbalanced situation will stabilize.
The Henry HUB (Gulf Coast US) Natural Gas sales index has also fallen to some 2.37 $/MMBTU as of July 2019 [14]. It seems the balance of 2019 for all world LNG exporters as well as importers could be a very unpredictable and perhaps unstable period for this sector of the world energy commerce if they are depending upon the spot market for their sales.
The August TOTM [1] cited this delicate situation when an “oversupply” of even such an important commodity as energy laden LNG is subject to the indissoluble framework of “Supply and Demand” in the world market. As such, with the U.S. entering the international LNG trade, new contract structures and business models are coming about, some of which are indexed to the Henry HUB pricing rather than the price of crude oil. As can be seen by the current sport market LNG prices, we are in a situation of oversupply, however, for importing countries with extra storage capacity, this represents a huge buyers opportunity.

Figure 7: Brent and WTI Oil Spot Price through mid-2019 [12]
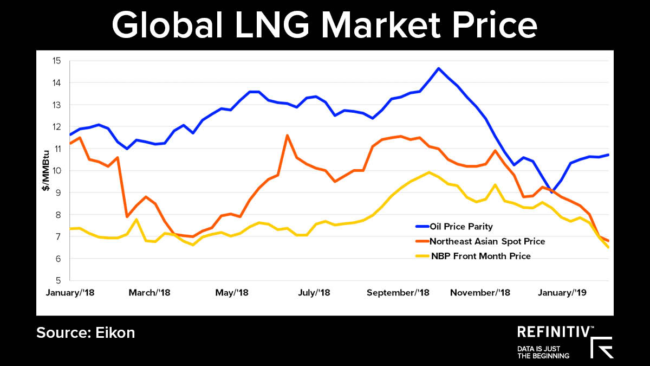
Figure 8. Global LNG Market Price Compared with Oil Parity and NBP Pricing

Figure 9. Global LNG Market Prices: Through June, 2019 [14]
Conclusions:
► A brief review of the USA’s LNG Export position for the years 2017-2018 were reviewed, showing that during 2017 the US exported some 16.4 BCM/yr (0.58 tcf/yr) or roughly 12.5 mtpa [2]. The 2018 Exports from the USA totaled 28.4 BCM/yr (1 tcf/yr) corresponding to 21 mtpa The US was the world’s 6th largest LNG exporter during 2017, and rose to number four, following Qatar, Australia, and Malaysia during 2018.
► A numerical analysis was presented to show that the actual Natural Gas to LNG std m3/m3 (scf/ft3) is not a universal constant generally accepted as 600. The term was shown to evolve from first converting the natural gas in std m3/tonne (scf/tonne) as a function of the molecular weight of the gas, and then converting the mass to liquid applying the LNG cryogenic density. Conversions were presented graphically, and the final gas to liquid LNG ratios were shown to vary discreetly between some 15 – 20 % below and above the 600 value.
► A discussion summarizing parity of energy calculations for LNG to crude oil values was provided. As can be seen, in 2019 there has been a divergence between the parity values of LNG to crude oil, largely attributed to oversupply in the market.
To learn more about LNG, we suggest attending our G2 (Overview of Gas Processing), G29 LNG (Short Course: Technology and the LNG Chain) and G4 LNG (Gas Conditioning and Processing-LNG Emphasis) courses.
By: Kindra Snow-McGregor
Sign up to receive the Tip of the Month directly to your inbox!
References:
1. K. Snow-McGregor , Tip of The Month, “A Primer on LNG – What is it, Where does it fit, and The New Kid on the Block,“ PS/JMC August – 2019
2. BP – Statistical Review of World Energy , 2018 ( for 2017)
3. BP – Statistical Review of World Energy , 2019 ( for 2018)
4. GIIGNL Annual Report 2019
5. https://ferc.gov/industries/gas/indus-act/lng/lng-existing-export.pdf
6. GCAP (Gas Conditioning and Processing) Computer Program – Version 9.3.2, PS/JMC – 2019
7. GPSA Engineering Data Book : 14th Edition – 2017
8. https://www.eia.gov/todayinenergy/detail.php?id=37852
9. https://www.csis.org/blogs/energy-headlines-versus-trendlines/oil-still-drives-asian-lng-prices
10. https://ycharts.com/indicators/japan_liquefied_natural_gas_import_price
11. Federal Energy Regulatory Commission (FERC) – 2018 (Waterborne Energy, Inc. Data supplied by HIS Global Inc.)
12. https://www.eia.gov/todayinenergy/detail.php?id=37852
13. REFINITIV EIKON LNG Prices – 2019
14. Energy Information Administration (EIA) – August 2019