Part 3 – Planes, Trains and Automobiles
Introduction: What are the “Other” Options for Transportation fuels
Part 2 of this Tip of the Month examined what are possible options to renewable energy for power generation that could result in meeting the Paris Accord and maintain the standard of living that industrialized nations have come to enjoy. This tip, Part 3, will focus on what are possible options for transportation fuels, and how do they compare overall in terms of reliability/cost and carbon footprint.
Technical solutions for alternative fuels for transportation are available, but the question becomes are they economic, available in the supply required, and do they actually result in a “net” reduction in carbon emissions. This tip of the month will review and compare the options available to date.
The Biggest Challenge: Flight
Airplanes are by far the most challenging in terms of finding adequate energy density alternative fuels. Electric power for commercial aircraft is impossible with today’s’ battery technology. It will likely remain so for many years unless there is some disruptive technology breakthrough that greatly increases the energy density of batteries to allow them to support flight. The only alternative that may be a replacement is bio-fuels.
Lufthansa has been researching and testing alternative fuels for flight since 2011 with Neste. Bio-fuels have been tested on 1,187 Lufthansa flights between Frankfurt and Hamburg in recent years. In October of 2019, Lufthansa committed to using the Neste MY Renewable Jet FuelTM on flights departing Frankfurt International airport [1]. The renewable jet fuel is made from wastes such as used cooking oil and requires that it be blended with conventional fossil fuels for flight. Neste’s estimated renewable jet fuel capacity is 100 000 tons annually. A reduction in CO2 emissions of roughly 80% is achieved using the bio-fuel as compared to traditional hydrocarbons [2].
In January of 2020, JetBlue announced that it would become the first U.S. airline to offset emissions from all of its domestic flights, aiming to be carbon neutral by July 2020 [3]. However, their primary approach is investing in projects that offset their CO2 emissions from their operations. The company will earn carbon credits by investing in solar and wind farm projects, landfill methane capture projects, as well as opportunities that protect forests from destruction. To achieve their offset goals, they will be working with sustainability consultants EcoAct and South Pose, as well as Carbonfund.org Foundation. JetBlue may also purchase Neste MY Renewable Jet FuelTM mixing between 25 – 40% with conventional fuel for their flights from San Francisco [3].
Alternative biofuels have been technically demonstrated, but they are unlikely to meet the emission reduction goals as outlined in CORSIA (Carbon Offsetting and Reduction Scheme for International Aviation). CORSIA aims for the airline industry to cap carbon output to 2020 levels and to cut emissions to half of those in 2005 by 2050. There is limited production capability of alternative fuels, and it is unlikely that production capacity and feedstock limitations could be resolved as quickly as global demand is increasing.
The U.S. Energy Information Administration’s, International Energy Outlook 2019, is projecting massive growth in global demand for jet fuel, with the demand steadily increasing through 2050. Jet-fuel consumption rate is projected to grow faster in countries that are not members of the Organization for Economic Cooperation and Development (OECD), primarily in China and other Asian non-OECD countries as is shown in Figure 1 [4]. This will be driven by greater demand for passenger air travel and freight air transport. Jet fuel consumption is being projected to increase at a faster rate than any other liquid transportation fuel through 2050 [4].

Figure 1. Global Jet Fuel Projections to 2019 [4]
Locomotives… I think I can…I think I can…
Alternative fuel solutions for trains (locomotives), are either LNG or electric. In 2018, Reganosa provided the LNG for Europe’s first LNG-fueled pilot locomotive test. The pilot test ran on a 20 km (12.4 mi) section from the Feve diesel train depot to Figaredo, in Asturias [5].
In 2015, the Florida East Coast (FEC) Railway began testing operations on LNG-fueled locomotives. In 2017, FEC Railway converted its entire line-haul locomotive fleet to run on LNG fuel. The new 24-unit fleet consists of 12 pairs of back-to-back GE ES44ACs with a purpose-built Chart Industries fuel tender in-between [6].
For electric-powered locomotives, the reduction in CO2 emissions is predicated on WHERE the batteries are manufactured, AND the power generation type used to charge the batteries. Unless the trains are in Norway (primarily hydro-electric), or possibly France (largely nuclear power), that is not a winning CO2 reduction solution for Europe or the United States at this time over 75% and 85% respectively of the energy is derived from hydrocarbons.
Automobiles… beware of false profits
Electric vehicles (EVs) are currently being promoted as being the end-all solution to the current “Green” energy economy globally. Granted, they might be at the cusp of competing with internal combustion engines (ICEs) in terms of cost (Figure 2) [7]. The reduction in pollution emissions where the car is being driven is significant (reduction in not only CO2, but NOx and SOx), but it does not take into account the entire vehicle life-cycle CO2 emissions. The net CO2 footprint depends upon where the car was manufactured (and what type of power generation that country utilizes) and the type of power generation used to charge said vehicle. Most batteries come from China, Thailand, Germany, and Poland that rely on non-renewable energy sources like coal for electricity. It is very difficult to compare all vehicles by the tailpipe CO2 emissions on a consistent basis. One must consider the cradle-to-grave emissions of the vehicle, from manufacture to disposal to estimate the true carbon footprint. As discussed in the December 2019 TOTM [8,9], making a 500 kg (1100 lbm) battery for a sport utility vehicle will emit 74% more CO2 than making a car with internal combustion [9]. The majority of countries around the world still depend upon coal-fired power generation, as a result, with the exception of very few countries (France – Nuclear Power, and Norway – Hydroelectric Power), electric vehicles do not result in a net CO2 reduction in emissions.
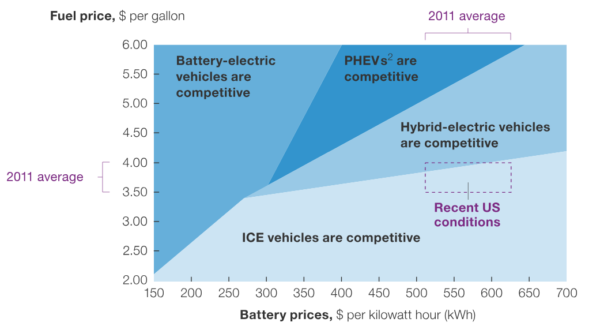
Figure 2. Cost of EVs and Hybrid Vehicles compared to ICE vehicles [7,8]
Another rarely discussed problem with EVs is cobalt, a needed element for current battery technology. There is a significant human cost for today’s batteries, from iPhones, iPads, EVs, and renewable energy back-up. Unfortunately, most people are not interested in how the products that they use are made, but just want to enjoy the benefits the technology provides to their immediate environment.
Over 50% of the worlds’ cobalt is mined in the Democratic Republic of the Congo (DRC), one of the worlds’ poorest nations. Much of this mining is done by children “artisanal” miners, which use no pneumatic tools or diesel draglines. A typical EV battery requires between 4.5 – 9 kg (10 – 20 lbm) of cobalt. The demand for cobalt is forecasted to triple by 2025. In 2016, corporate concerns increased after a report from Amnesty International identified two dozen electronics and car companies that had failed to do enough to ensure that their supply chain did not include cobalt produced from child labor [10]. The problem is complex, as the DRC is economically dependent upon mining, and companies choosing not to do business there will likely make the populations living situation worse. But faced with severe corruption problems, it remains to be seen how the DRC can implement the required changes to mitigate the child labor issues.
The Natural & bio Gas Vehicle Association (NGVA Europe) is promoting Natural Gas Vehicles (NGV) and have been making significant strides towards their goal of using 20% alternative fuels by 2020 (CNG) and LNG. This organization started with the LNG Blue Corridors beginning with 50 LNG stations when launched. Today there are 155 LNG stations, 51 000 passenger vehicles, 8 100 light commercial vehicles, 159 CNG trucks, and 1 642 LNG vehicle registrations. The goals for the natural gas fleet development are shown in Figure 3 [11].

Figure 3. NGVA Europe – Goals for Natural Gas Vehicle Fleet in Europe [11]
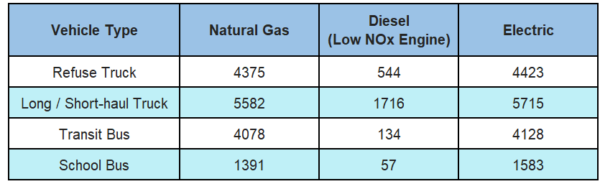
In the U.S., NGV America estimates that there are 175 000 NGVs, and more than 23 million worldwide. In the states, there are roughly 1600 CNG and 140 LNG fueling stations, as well as over 50 different vehicle manufacturers that can produce 100 different models of light, medium and heavy natural gas vehicles. It is estimated that heavy and medium duty vehicles are the number one source of smog. Heavy-duty vehicles (short-haul / long-haul / refuse trucks, school/transit buses) produce nearly 50 percent of all smog-precursor emissions and 20 percent of all transportation greenhouse gases [12]. Table 1 provides an estimate on the lbs of NOx reduced for heavy duty vehicles as reported by NGVA, and calculated by Argonne National Laboratory Heavy-Duty Emissions Calculator [13].
Table 1. Pounds of NOx Reduction Comparison for HDVs versus Standard Diesel Engine [13]
The big story with NGVs is the energy value or price differential of the fuel as compared to gasoline or diesel. Granted, new NGVs are more expensive (including engine conversions) than traditional vehicles, but the cost is offset by the price of the fuel. Figure 4 provides a fuel cost comparison for Europe [11], while Table 2 provides cost comparison data for the United States.

Figure 4. Energy value / costs of different transportation fuels [11]
Table 2. U.S. Clean Cities Alternative Fuel Comparison [14]

The energy content of liquid fuels differ from one another, thus the price paid per gallon is not consistent for easy comparisons. Table 2 provides liquid fuel prices normalized to an energy-equivalent basis for easy comparison. From July 2019 to October 2019 in the U.S., CNG national average cost was roughly $0.48 less than gasoline, and $0.59 less than diesel. The LNG national average was $0.39 less than diesel [14].
Maritime Fuels
Marine transport has been a significant focus for LNG use as a fuel due to the establishment of marine Emission Control Areas (ECA), where the level of particulate emissions and SOx and NOx are strictly controlled. Well established ECAs are on the coasts in the Baltic and northern European waters and the USA east and west coast. Very soon the Mediterranean Sea will be similarly controlled.
In addition, January 1, 2020, the sulfur limit applicable to all marine fuels used across the world (excepting those ships using exhaust gas cleaning equipment or alternative fuels) was reduced from 3.5% to 0.5%. As a result, in recent years there has been a significant increase in LNG-powered ship operation, as well as new ships ordered.
In 2019, there were roughly 143 LNG-powered vessels as compared to approximately 120 vessels in 2017. An additional 135 LNG powered vessels were placed on order, and there were an additional 135 LNG-ready ships either in operation or on order [15].
The types of ships which are considered candidates for using LNG as a fuel include:
►Tugs and supply boats which operate from a base and can be easily refueled each day from tanker trucks.
►Container and cruise ships that call at ports within ECAs. These ships require more fuel, as much as 500-1000 tons of LNG, making refueling from tanker trucks virtually impossible resulting in the development of LNG bunker ships.
►Offshore service ships and boats for Oil and Gas production platforms
With that said, LNG bunkering for maritime ships is positioned to become big business. The projection from Shell LNG 2019 is that in 2030, the demand for Marine LNG will be 20 mtpa.
Summary
This tip of the month summarized some of the alternative fuel options for transportation. Bio-diesel and bio-natural gas are great alternatives, however, there is insufficient supply to provide the world’s transportation fuel demands. Out of all of the technically feasible options proven today, natural gas provides the cleanest alternative in comparison to current liquid fuel usage for nearly all types of transportation, with the exception of flight. Clearly bio-jet fuel is a great solution, however, significantly more production must be developed quickly. Given the projections in the increase of jet-fuel demand it will be unlikely to be resolved with bio-jet fuel alone. The next, and final tip of the month in this series will be focused on our dependence on the petrochemical industry, which is the most challenging issue of all with going net zero by 2050.
To learn more about the global natural gas economy, we suggest attending our G2 (Overview of Gas Processing).
By: Kindra Snow-McGregor, P.E.
References
1. Lufthansa to use Neste sustainable aviation fuel in Frankfurt, Flight Global, 2 October 2019.
2. https://www.neste.com/companies/products/renewable-fuels/neste-my-renewable-jet-fuel
3. JetBlue moves to use renewable fuel and become first carbon-neutral U.S. airline, Los Angeles Times, 06 January 2020.
4. International Energy Outlook 2019, U.S. Energy Information Reganosa provides fuel for first European LNG-fueled locomotive, LNG World, 4 January 2018.
5. https://fecrwy.com/news/blog-lng-operations/
6. U.S. Energy Information Administration, McKinsey analysis
7. Lithium Batteries’ Dirty Secret: Manufacturing Them Leaves Massive Carbon Footprint, Niclas Rolander, Jesper Starn, and Elisabeth Behrmann, Bloomberg, 16 October 2018.Hyne, Norman, Ph.D. Nontechnical Guide to Petroleum Geology, Exploration, and Production, Pennwell, 1995.
8. Natural Gas and Renewables Part 1, December 2019 Tip of the Month, McGregor.
10. Blood, Sweat and Batteries, Walt V. and Meyer, S., Fortune, 23 August 2018.
11. NGVA Report of Activities 2017 – 2018
12. Game Changer Technical White Paper, Gladstein, Neandross and Associates, May 2016.
13. https://www.ngvamerica.org/environment/
14. Clean Cities Alternative Fuel Price Report, October 2019
15. 2019 will be the year of acceleration for LNG as a Marine Fuel, Keller, P., The Maritime Executive, 2 February 2019.