Amine solutions can be used to remove hydrogen sulfide and/or carbon dioxide from hydrocarbon liquid streams. The reactions involved are essentially the same as those for removing the same constituents from natural gas. The primary difference in this process and the amine-gas sweetening process is the handling of two liquid phases in intimate contact [1]. Guidelines for sweetening LPGs (Liquified Petroleum Gases) with amines including amine type, concentration, filtration, temperature, loading, circulation rate and water-wash systems are presented in reference [2]. Any of the commonly available amines such as monoethanolamine (MEA), diethanolamine (DEA), diglycolamine® (DGA®) [both are trademarks of Huntsman Corporation], methyl diethanolamine (MDEA) and MDEA-based solvents usually perform satisfactorily. For further detail of liquid hydrocarbon treating refer to references [1-2].
Depending on the temperature, pressure, and concentration of the amine there is an equilibrium solubility in the hydrocarbon phase. The dissolved amine will be carried past the contactor with treated hydrocarbon liquids. Adjusting the operating temperature and pressure of the liquid treater is typically not feasible as these parameters are maintained within a range that ensures the hydrocarbon phase remains liquid. The parameter that can be adjusted to reduce solubility losses is concentration. Teletzke and Madhyani [3] present solubility charts of MDEA in pure ethane, propane and butane which indicate MDEA solubility increases rapidly when operating above a 40 – wt. % concentration. For this reason, operating liquid treaters with an amine concentration greater than 40 wt. % is not recommended [3]. In general, when rich loading and treating requirements are not a concern, reducing concentration can help reduce solubility losses in liquid treaters [3].
In this Tip of The Month (TOTM), similar to the July 2018 TOTM [4], the effect of pressure, temperature, MDEA concentration and rich amine loading (circulation rate) on the MDEA solubility loss from the contactor top is investigated. Specifically, this study focuses on the variation of MDEA solubility losses with the feed sour LPG pressure in the range of 1379 kPag to 2069 kPag (200 psig to 300 psig). For each pressure, temperature varied from 15.6 °C to 43.3 °C (70 °F to 110 °F). Two amine concentrations of 25 and 50 wt. % and rich loadings of 0.2 and 0.4 moles of CO2 plus H2S per mole of MDEA were considered.
By performing the rigorous computer simulations of an MDEA treating/sweetening process, several charts for demonstrating the impact of pressure, temperature, concentration, and rich loading on the MDEA solubility loss are presented.
CASE STUDY
For the purpose of illustration, this tip considers treating/sweetening of 22.7 Sm3/h (100 sgpm) of a sour LPG containing H2S and CO2 using MDEA. Table 1 presents its composition and flow rate. The feed sour LPG pressure was varied from 1379 kPag to 2069 kPag with an increment 345 kPa (200 psig to 300 psig with an increment of 50 psi). For each pressure, the temperature was varied from 15.6 °C to 43.3 °C with an increment of 5.5 °C (70 °F to 110 °F with an increment of 10 °F). This tip uses ProMax [5] simulation software with “Amine Sweetening – PR” property package to perform all simulations.
Table 1. Feed composition and flow rate
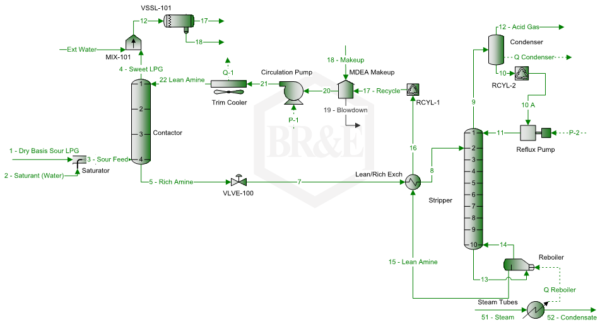
Figure 1 presents a simplified LPG treating/sweetening process flow diagram by MDEA for the case study. Note this diagram has a trim cooler to control the top temperature of the contactor, and a reflux condenser that minimizes the water and MDEA losses via the acid gas stream.
Figure 1. Simplified process flow diagram for LPG sweetening unit by MDEA [5]
Note this diagram has an external water wash of the sweet LPG stream leaving the contactor top. Usually stream 18, amine/water stream, is returned to the amine system downstream of VLVE-100, which will reduce the amine make-up and allow HC to flash. Stream 18 and “18 – Makeup” should be almost the same by adjusting the stream “Ext Water” rate.
The following specifications/assumptions for the case study are considered:
Contactor Column
► Feed sour LPG is saturated with water
► Number of theoretical stages = 4
► Pressure drop = 20 kPa (3 psi)
► Lean amine solution temperature = Sour LPG feed temperature plus 2.8 °C (5 °F)
Regenerator/Stripper Column
► Number of theoretical stages = 10 (excluding condenser and reboiler)
► Feed rich solution pressure = 414 kPag (60 psig); typically stream 8 has a letdown valve to reduce pressure to the stripper column pressure.
► Feed rich solution temperature = 98.9 ℃ (210 ℉ ); this is conservative and could be 107 °C at 414 kPag (225 °F at 60 psig)
► Condenser temperature = 48.9 ℃ (120 ℉ ); this reflects warm climate with aerial cooler
► Pressure drop = 21 kPa (3 psi)
► Bottom pressure and temperature = 110 kPag (16 psig), about 126 °C (259 °F)
Reboiler Duty
► Steam rate = 132 kg of steam/m3 of amine solution (1.1 lbm/gallon) times amine circulation rate
► Saturated steam pressure = 348 kPag (50 psig) at 147.7 °C (297.7 °F)
Heat Exchangers
► Lean amine cooler pressure drop = 35 kPa (5 psi)
► Rich side pressure drop = 35 kPa (5 psi)
► Lean side pressure drop = 35 kPa (5 psi)
Main Pump
► Discharge Pressure = Feed sour gas pressure + 35 kPa (5 psi)
► Efficiency = 65 %
Reflux Pump
► Discharge Pressure = 350 kPa (50 psi)
► Efficiency = 65 %
Lean Amine Concentration and Circulation Rate
MDEA concentration in lean amine = 25 and 50 weight %
► Lean amine circulation rate was adjusted (by solver tool) to reach a specified rich loading (0.15, 0.2, 0.3, or 0.4 mol acid gases/mol MDEA) while reducing the H2S CO2 concentration in sweet LPG to less than 4 ppmw
► Total acid gas loadings in lean solution in the range of ~0.002 to 0.006 mol acid gases/mol of MDEA
Rich Solution Expansion Valve
Outlet pressure = 448 kPa (65 psia)
RESULTS AND DISCUSSIONS
For the above specifications, ProMax [5] is used to simulate the process flow diagram in Figure 1. The objective was to produce a sweet LPG with less than 4 ppmw H2S and CO2. In order to meet these specifications, the required lean MDEA solution volumetric rate was determined by the solver tool and then the calculated operation parameters were recorded.
Three feed gas pressures and for each pressure 5 temperatures were simulated. For clarity and to avoid crowded curves on the diagrams, only the results for the lowest and the highest pressures are presented.
The variation of MDEA solubility loss to sweet LPG as a function of pressure, MDEA wt. %, rich solution loading and temperature are presented in the following section. In all cases the sweet LPG pressure was 21 kPa (3 psi) lower than the feed LPG pressure.
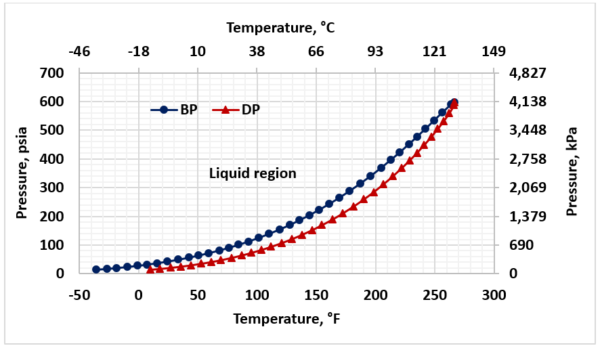
Figure 2 presents the phase behavior for sour LPG (Table1). To avoid vaporization, throughout of the sweetening process the LPG stream should remain in the liquid region (to the left of bubblepoint curve).
Figure 2. Sour LPG phase behavior
Effect of Pressure:
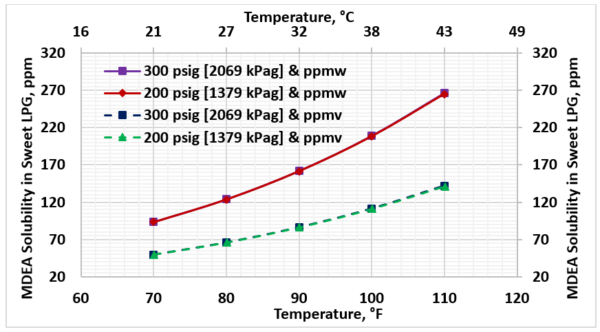
For rich solution loading of 0.4 mol acid gases per mol MDEA and 50 wt. % MDEA concentration, Figure 3 presents the solubility of MDEA in the sweet LPG in terms of ppmw (the top two curves) and ppmv (the lower two curves) as a function of temperature. The two pressures are 1379 kPag and 2069 kPag (200 psig and 300 psig). Note the MDEA solubility in the sweet LPG is not affected by pressure but increases with temperature increase.
Effect of Loading:
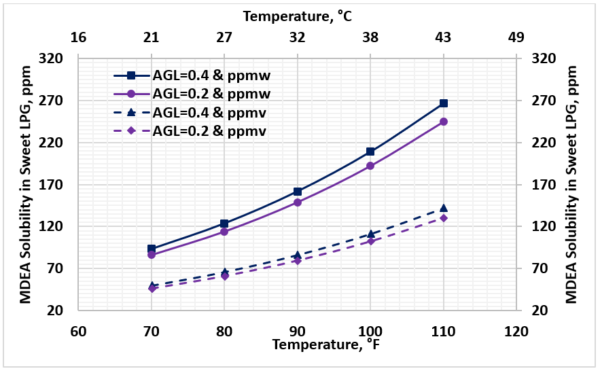
For 50 wt. % MDEA solution and pressure of 2069 kPag (300 psig), Figure 4 presents the solubility of MDEA in the sweet LPG in terms of ppmw (the top two curves) and ppmv (the lower two curves) as a function of temperature. The two rich solution loadings are 0.2 and 0.4 mol acid gases per mol of MDEA. Note the MDEA solubility in the sweet LPG increases with increase in rich solution loading and temperature.
Figure 3. Variation of MDEA solubility in the sweet LPG with temperature and pressure (50 wt.% MDEA, 0.4 mol acid gases/mol MDEA, and no water wash)
Figure 4. Variation of MDEA solubility in the sweet LPG with temperature and rich solution loading (50 wt. % MDEA, 2069 kPag (300 psig), and no water wash)
MINIMIZING MDEA SOLUBILITY IN LPG
Amine in LPG can result in quality issues for the LPG and may cause problems particularly in butane streams that might be used in gasoline blending. Amine can damage the fuel gauge sensing units.
An important piece of equipment for minimizing MDEA in liquid treaters is an internal and/or external water-wash system to recover any dissolved MDEA. While some solubility losses will occur in all systems; a water wash system provides an efficient recovery method to minimize these losses and remove MDEA from the treated LPG [3, 6].
Figure 5 presents a segment of the process flow diagram in Figure 1 with the internal and external water wash. Streams “In Water” and “Ext Water” are the internal and external water wash, respectively. Note stream “In Wash” enters the contactor at tray 1 and the lean MDEA stream enters at tray 2.
Stream 17 (continuous phase) is the treated LPG and stream 18 (disperse phase) is the effluent washed water. The “In Water” wash flow rate was about 0.035 % of the sour LPG volume rate, very close to the makeup water rate needed to maintain MDEA concentration. The “Ext Water” wash flow rate was about 0.1% of the sour LPG volume rate.
Figure 5. Schematic of the internal (In Water) and external (Ext Water) wash system
Figure 6 shows that solubility of MDEA in the sweet LPG with no water wash increased rapidly when operating above a 40 – wt. % MDEA concentration. This is in agreement with the chart in reference [3] for pure liquid hydrocarbon. For this reason, operating liquid treaters with an MDEA concentration greater than 40 wt. % is not recommended [3, 6]. In general, when rich loading and treating requirements are not a concern, reducing concentration can help reduce solubility losses in liquid treaters [3,6]. Figure 6 also shows the impact of water wash on the MDEA solubility loss for the internal water wash only, the external water wash only, and the internal plus external water wash.
Figure 6. Variation of the MDEA solubility loss in the sweet LPG with the MDEA concentration at 43.3 °C (110 °F), 2069 kPag (300 psig) and rich loading of 0.4 mol acid gases per mol MDEA.
For rich solution loadings of 0.2 and 0.4 mol acid gases per mol MDEA and 50 wt. % MDEA, Figure 7 presents the solubility of MDEA in the sweet LPG as a function of temperature at 2069 kPag (300 psig). The curves show results for no water wash (top two), with internal water wash (middle two), and internal plus external water wash (lower two curves). Figure 8 is like Figure 7 with the exception that MDEA concentration is 25 wt. %.
Figure 7. Solubility of MDEA in the sweet LPG with no water wash, with internal water wash, and internal plus external water wash as a function of temperature for 0.2 and 0.4 rich solution loading and 50 wt. % MDEA at 2069 kPag (300 psig).
Figure 8. Solubility of MDEA in the sweet LPG with no water wash, with internal water wash, and internal plus external water wash as a function of temperature for 0.2 and 0.4 rich solution loading and 25 wt. % MDEA at 2069 kPag (300 psig).
Like Figure 6, Figures 7 and 8 indicate that the water washing reduces the MDEA solubility loss and the losses for 25 – wt. % MDEA are much lower than the loss for 50 – wt. % MDEA.
Figure 9 shows pressure-temperature profile from the inlet of contactor and through four trays from bottom to the top of contactor for feed pressures 1379 KPag and 2069 kPag (200 psig and 300 psig) and the LPG bubblepoint curve. This figure indicates the LPG remains as liquid during treating process.
Figure 9. Pressure-Temperature profile through treating process
CONCLUSIONS
Based on the results obtained for the considered case study, this TOTM presents the following conclusions:
► Throughout the column and water washing process the operating temperature should be lower than the bubblepoint temperature to avoid LPG vaporization (Figs 2,9).
► As the feed LPG temperature to the contactor column increases, the MDEA solubility loss to LPG increases whereas pressure effect is negligible (Fig 3).
► As the rich solution loading increases, MDEA solubility loss increases (Figs. 4,6,7).
► As the MDEA wt. % increases, the MDEA solubility loss to LPG increases (Figs. 5,6,7). To minimize MDEA solubility loss operate with MDEA concentration less than 40 wt. %. Internal and/or external water wash reduce the MDEA solubility loss.
► Even though not studied in this TOTM, mechanical and entrainment losses from the contactor top and regenerator top as well as losses due to filter change are also sources of loss and are much higher than the solubility losses presented here.
To learn more about similar cases and how to minimize operational troubles, we suggest attending our G6 (Gas Treating and Sulfur Recovery), G4 (Gas Conditioning and Processing), G5 (Advanced Applications in Gas Processing),PF4 (Oil Production and Processing Facilities), PF49 (Troubleshooting Oil and Gas Processing Facilities) courses.
Written By: Mahmood Moshfeghian, PhD


