The main issue for cryogenic processing and transporting of a gas stream containing carbon dioxide is its frost formation. Solid carbon dioxide (dry ice) may form at low pressures when the temperature of a gas stream containing CO2 drops below the triple point temperature of CO2. The triple point temperature and pressure of CO2 are -56.57 °C (-69.83 °F) and 518 kPa (75.12 psia) respectively. Its critical temperature and pressure are 31.10 °C (87.98 °F) and 7386 kPa (1,071 psia). Frost point occurs along the solid-vapor equilibria (SVE) curve. In addition, CO2 is corrosive in water wet systems and it reduces the gas heating value and Wobbe Index (number). There are limits on CO2 concentration in the sales gas and liquid products as a result. The sales-gas/transportation by pipeline specification limits the CO2 concentration to 1 – 3 mole %. To avoid frost formation in cryogenic gas processing, removal of CO2 is often required to meet the downstream processing requirements. Types of processing include:
- Deep NGL extraction plants: typically, less than 0.5 to 1.0 mole % depending on the process used
- LNG liquefaction plants: less than 50 ppmv
- N2 rejection, He recovery: less than LNG feed
Therefore, it is important to estimate accurately the temperature where carbon dioxide solidifies. The solid – vapor equilibria (SVE) of natural gas systems containing carbon dioxide may be predicted accurately using simulation programs.
In continuing the March and April 2018 tip of the months (TOTMs) [1, 2], this study was undertaken to prepare simple charts for estimation of CO2 frost temperature or pressure of binary and ternary systems containing CH4, C2H6, and N2, and CO2. The charts present frost temperature (or pressure) of CO2 + light hydrocarbons and nitrogen mixtures as a function of pressure (or temperature) and CO2 concentration for a wide range of temperature from -80 °C to -120 °C (-112 °F to -184 °F). The pressure range was from about 100 kPa to 3500 kPa (14.5 psia to 508 psia) and the CO2 concentration range was from about 0.1 to 55 mole %. For each case, the accuracy of charts will be compared with experimental data.
Figure 1 [3] presents the phase diagram for pure CO2. Regions S, L, and V denote the Solid, Liquid, and Vapor phase, respectively. Point C is the critical point and point T is the triple point where the three phases of solid-liquid-vapor coexist. Figure 1A (FPS) is presented in Appendix A. The symbols represent experimental [4] data and the solid curves were predicted by the Nasrifar – Bolland equation of state [5].
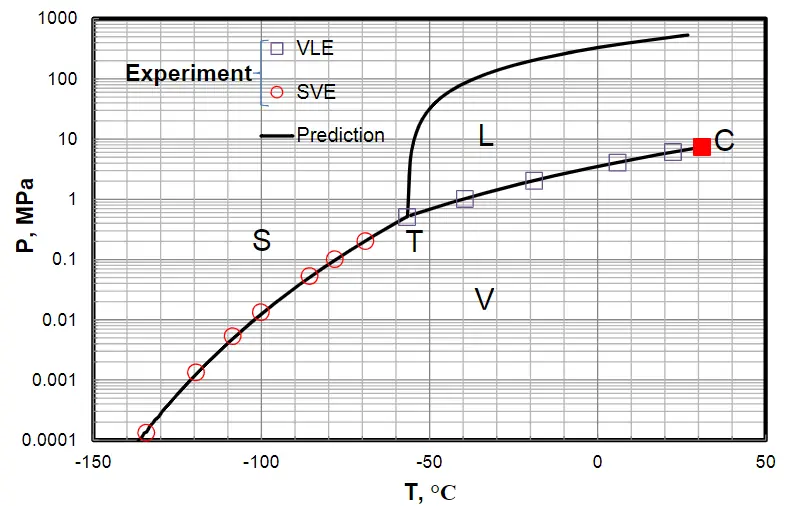
Figure 1
Validation of Thermodynamic Package
To validate the accuracy of the ProMax [6] simulation program, its Peng – Robinson equation of state and Freeze Analysis Tool were utilized to predict the solid formation temperature of binary mixtures of CO2 + CH4 as a function of pressure and CO2 composition. The predicted frost temperatures were compared with the experimental data. Figures 1 and 2 present the frost point temperature as a function of pressure and composition for two sets of experimental data [7, 8] and the ProMax predicted values [6].
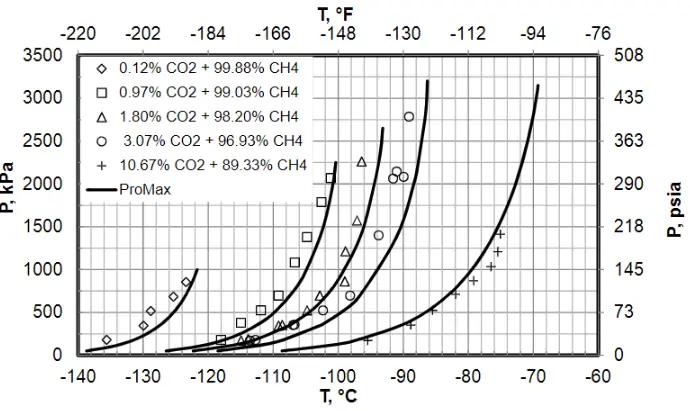
Figure 2
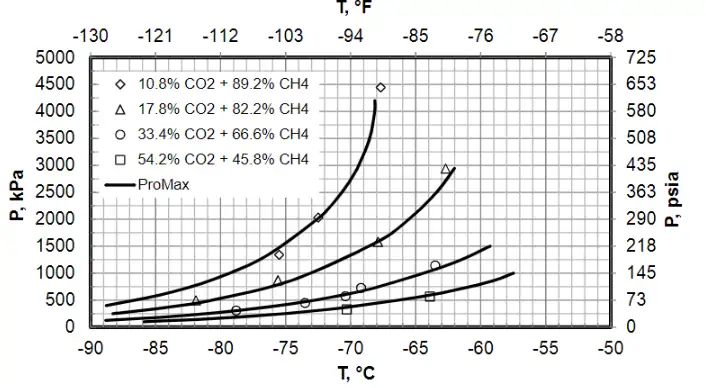
Figure 3
The average absolute relative error (AARE) % for 42 frost temperatures (in K or °R) of Figure 2 predicted by ProMax compared to the corresponding experimental values [7] is 1.27%. Similarly, the AARE % for 17 frost temperatures (in K or °R) of Figure 3 predicted by ProMax compared to the corresponding experimental values [8] is 0.27%. Tables 1A and 2A in Appendix A present the point-by-point comparisons. The error analysis of Figures 2 and 3 indicates that the predicted frost temperatures by ProMax is accurate for facilities equipment design and troubleshooting.
The frost pressure for the binary system of CO2 + CH4 as a function of CO2 mole fraction at a specified temperature was estimated by adjusting the pressure using the solver tool of ProMax to match the experimental frost temperature. The estimated frost pressures for six isotherms are compared with the corresponding experimental values [9] in Figure 4.
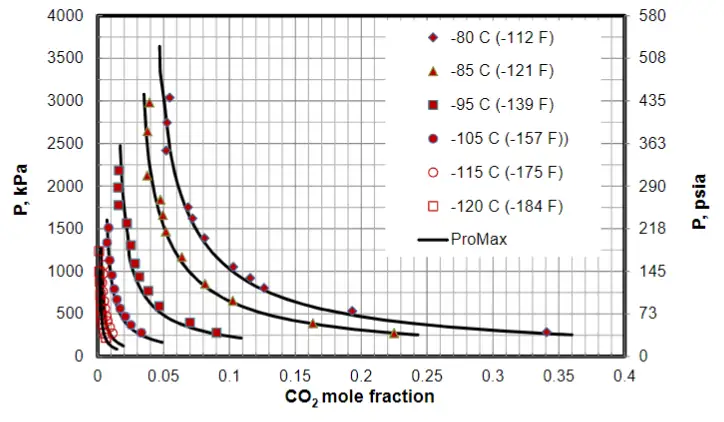
Figure 4
Similarly, Figures 5 and 6 present the experimental [9] and ProMax estimated frost pressure of the ternary system of CO2 + CH4 + N2 as a function of CO2 mole fraction and five isotherms for 3 mole % and 5 mole % N2, respectively. These two figures and Figure 6A (in Appendix A) indicate that the frost pressure is the same at a given CO2 content and an isotherm for nitrogen content of 3 mole % and 5 mole %.
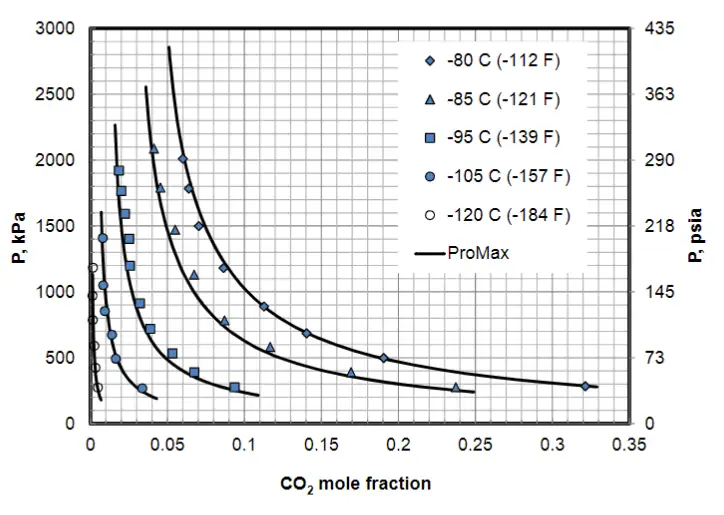
Figure 5
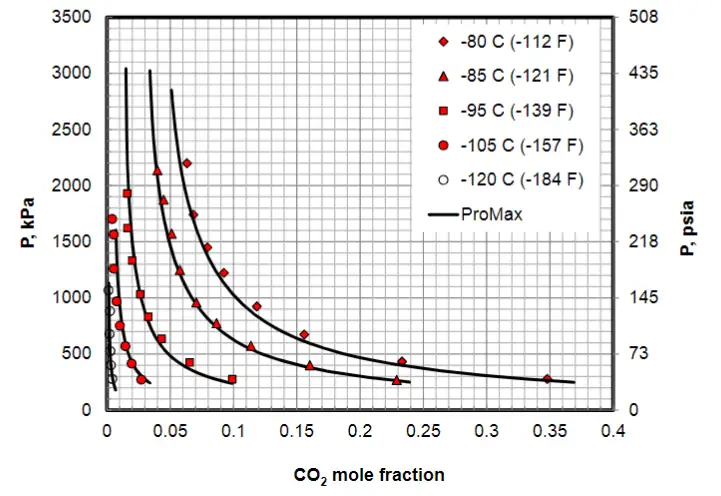
Figure 6
Similarly, Figures 7 and 8 present the experimental [9] and estimated frost pressure of the ternary system of CO2 + CH4 + C2H6 as a function of CO2 mole fraction and five isotherms for 3 mole % and 5 mole % C2H6, respectively. These two figures and Figure 8A (in Appendix A) indicate that the frost pressure is the same at a given CO2 content and an isotherm for ethane content of 3 mole % and 5 mole %.
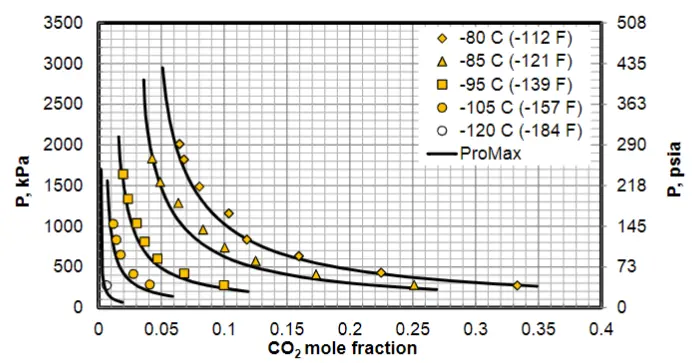
Figure 7
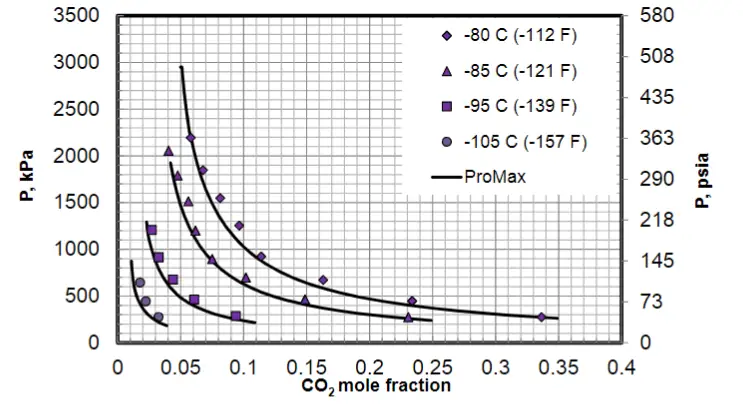
Figure 8.
Summary
Based on the work done in this tip, the following can be concluded:
- pure CO2, as pressure increases, the frost temperature increases (Figure 1)
- CO2 concentration has a great impact on the mixture frost point pressure and temperature.
- At constant pressure, as CO2 concentration increases the mixture frost temperature increases (Figures 2 – 3).
- At constant temperature, as CO2 concentration increases the mixture frost pressure decreases (Figures 4 – 8).
- At constant temperature, concentration of 3 and 5 mole % N2 or C2H6 has little or no effect on the frost pressure of gas mixtures containing CO2 + CH4 (Figures 5, 6, 6A, 7, 8, and 8A).
- ProMax is relatively accurate for frost point estimation for gas mixtures of light hydrocarbons and CO2 (Tables 1A and 2A and Figures 4 – 8).
- Simple charts are presented for accurate estimation of frost point for gas mixtures of light hydrocarbons, nitrogen and CO2 as a function of pressure (or temperature) and CO2 concentration (Figures 2 – 8). These charts are composition specific, similar charts should be developed for different compositions. In a future TOTM, similar charts will be presented for typical natural gas mixtures.
- Knowledge of phase boundaries and behavior is essential for frost point calculation.
Written By: Mahmood Moshfeghian, Ph.D.
References
- M. Moshfeghian, “http://www.jmcampbell.com/tip-of-the-month/2012/04/natural-gas-with-dry-ice-phase-behavior/,” PetroSkills tip of the month, Apr 2012
- M. Moshfeghian, “http://www.jmcampbell.com/tip-of-the-month/2018/04/impact-of-co2-on-natural-gas-density/” PetroSkills tip of the month, Apr 2018
- Kh. Nasrifar and M. Moshfeghian, “Prediction of carbon dioxide frost point for natural gas model systems,” Submitted for publications, May 2019
- NIST Chemistry WebBook; http://webbook.nist.gov/chemistry/ [Cited 26 April 2019]
- K. Nasrifar, O. Bolland, Prediction of thermodynamic properties of natural gas mixtures using ten equations of state including a new cubic two-constant equation of state, J. Pet. Sci. Eng. 51 (2006) 253-266.
- ProMax 5.0, Build 5.0.19050.0, Bryan Research and Engineering, Inc., Bryan, Texas, 2019.
- G.M. Agrawal, R.J. Laverman, Phase behavior of the methane carbon dioxide system in the solid-vapor region, Adv. Cryog Eng. 19 (1974) 317-338.
- L. Zhang, R. Burgass, A. Chapoy, B. Tohidi, E. Solbraa, Measurement and modeling of CO2 frost points in the CO2 – methane systems, J. Chem. Eng. Data 56 (2011) 2971-2975.
- X. Xiong, W. Lin, R. Jia, Y. Song, A. Gu, Measurement and calculation of CO2 frost points in CH4 + CO2/CH4 + CO2 + N2/CH4 + CO2 + C2H6 mixtures at low temperatures, J. Chem. Eng. Data 60 (2015) 3077-3086.