Estimation of Surface Tension of Hydrocarbon Liquids in Equilibrium with Natural Gas Mixtures
Mahmood Moshfeghian, Ph.D.
These correlations and the smoothed experimental data were used to generate three figures for methane through n-octane and a few heavy ends with known molecular weights.
The summary of error analysis indicated that the accuracy of the generated figures and the two correlations are good and can be used for facilities calculations. Because of the simplicities and ease of calculations, the two correlations are suitable for hand calculations.
In this follow-up TOTM, an estimation method for surface tension of paraffin liquid mixtures in equilibrium with natural gas having a fixed feed composition are presented.
How to Estimate Surface Tensions () of Natural Gas Mixtures?
 ) of Natural Gas Mixtures?
The surface tension of a liquid mixture is not a simple function of the surface tensions of the pure components because, in a mixture, the composition of the surface is not the same as that of the bulk. Typically, we know the bulk composition but not the surface composition [2]. Section 12-5 of reference [2] provides details of the liquid mixtures surface tensions estimation procedures. In this TOTM a semi-empirical approach based on the Macleod [3] basic relationship (Eq. 1) for as a function of liquid mixture Parachor, PLm , and the liquid, PLm , and vapor, PVm , densities in kg/m3 (lbm/ft3).
(1)
 (1)
(1)Where is fresh water 1000 kg/m3 (62.4 lbm/ft3) and the liquid mixture molecular weight, MWcor, may be estimated from Eq. 2.
 is fresh water 1000 kg/m3 (62.4 lbm/ft3) and the liquid mixture molecular weight, MWcor, may be estimated from Eq. 2.
(2)
(3)
 (3)
(3)The liquid mixture Parachor, PLm, may be estimated from Eq. 4.
(4)
 (4)
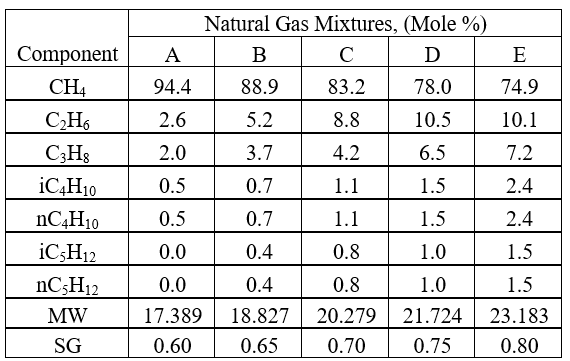
(4)To evaluate the accuracy Eqs. 1-4, the SRK EOS option in ProMax [4] was used to generate the liquid mixture surface tension, for various values of pressure, temperature, and feed natural gas relative density. The total number of values calculated was 236. Table 1 presents the composition of five different natural gas feed mixtures with gas relative densities of 0.60-0.80 used in this study. To generate the data used for this TOTM, the feed gas composition was flashed at various temperatures and pressures to be within the two-phase region to generate the liquid hydrocarbon mixture that would be in equilibrium with the gas phase at said conditions. As a result, the total combined composition of the vapor and the liquid are fixed by the feed composition. For each surface tension data point, the vapor and liquid compositions and densities change depending upon the temperature and pressure conditions of the flash calculation. Given the number of data points generated in this TOTM (236), an example of a flash calculation result from ProMax, and the resulting liquid surface tension estimation using the equation provided and the accuracy is compared to the ProMax program output.
Table 1. Gas compositions used for generating values
Figures 1 through 5 show variations of with pressure, temperature, at a specified feed gas relative density. The pressures at each isotherm must be within the two-phase gas and liquid region where the can be calculated for the liquid phase. Figures 1 through 4 (gas relative density of 0.60 - 0.75) cover all the isotherms. In the case of gas relative density of 0.80, for clarity and avoiding overlaps, Figure 5a covers isotherms colder than -40 °C (-40 °F) and Figure 5b covers isotherms -40 °C (-40 °F) and warmer.


To estimate surface tension, for each data point at specified temperature, pressure, and composition (gas relative density), the liquid and gas density calculated by ProMax were substituted in Eqs. 3, 2, 4, and 1 in the same order (See an Example in the appendix).
Table 2 shows the summary of error analysis for all data points using Eqs.1-4 when original exponent 4 in Eq.1 was used.
(1)
 (1)
(1)Table 2. Summary of error analysis for all data points using original exponent of 4 in Eq.1

Likewise, Table 3 shows the summary of error analysis for all data points using Eqs.1-4 when modified exponent 4 in Eq.1 is used.
(1A)
 (1A)
(1A)Table 3. Summary of error analysis for all data points using modified exponent of 4.86 in Eq.1

(5)
 (5)
(5)(6)
 (6)
(6)
Summary:
Using the SRK-EOS option in ProMax [4], generated Figures 1 – 5 to estimate liquids mixtures surface tensions, , as a function of temperature and pressure at a specified feed gas relative density in the range of 0.6 to 0.8. Please note that these charts may be used to estimate liquid hydrocarbon surface tension if their inlet gas composition is close to that to one of the compositions listed in Table 1, finding the appropriate surface tension chart, and then read of surface tension at the temperature and pressure of interest. In addition, the accuracy of a semi empirical approach based on the Macleod [3] basic relationship (Eq. 1) to estimate was evaluated against the surface tension values calculated by ProMax [4]. The summary of the error analyses in Tables 2 and 3 indicate that a considerable accuracy improvement is obtained by replacing the original exponent of 4 in Eq. 1 with 4.86.
To learn more about similar cases and how to minimize operational problems, we suggest attending our G4 (Gas Conditioning and Processing), G5 (Practical Computer Simulation, and Applications in Gas Processing) courses.
References:
1. Moshfeghian, M., //en/blog/entry/dec2021-totm-surface-tension, Estimation of Surface Tension of Pure Paraffin (Alkane) Hydrocarbons, Dec 2021.
2. Poling, B. E., Prausnitz, J. M., O’Connell, J.P., The properties of gases and liquids, 5th Ed., McGraw-Hill, San Francisco, California, 2001
3. MacLeod, D. B., Trans. Faraday Soc., 19 (1923), p. 38.
4. ProMax 5.0, Build 5.0.20034.0, Bryan Research and Engineering, Inc., Bryan, Texas, 2020.
Appendix: Example Flash Calculation Results, and Corresponding Surface Tension Estimates
Example
For the feed gas E in Table 1 with relative density of 0.70, calculate the liquid surface tension at 10 °C (50 °F) and 7000 kPa (1015 psia).
ProMax Solution:
1. Plot phase envelope

2. Flash calculation results at T & P

3. Calculated properties at the specified T & P

Shortcut Solution:

Calculate α by EQ. 3:

Calculate MWcor, by Eq. 2.

Calculate The liquid mixture Parachor, PLm, by Eq. 4.

Calculate surface tension by Eq. 1:

ProMax = 3.54 dyne/cm, APD = 100(|3.54-3.15|)/3.54 = 11%
AD= (|3.54-3.15|) =0.39 dyne/cm
Calculate surface tension by Eq. 1A:

ProMax = 3.54 dyne/cm, APD=100(|3.54-4.04|)/3.54 = 14.1%
AD= (|3.54-4.04|) =0.5 dyne/cm