Viscosity is a measure of fluid’s resistance to flow caused by internal friction generated when the fluid molecules are sheared. Because the intermolecular forces are a function of the distance between molecules, viscosity depends on whether the fluid is a liquid or gas at system temperature, pressure, and compositions [1].
There are two types of viscosity
1. Absolute or dynamic viscosity, µ, with the units of centipoise, cP, or mPa-s (milli Pascal-seconds). cP/1000 = kg/(m-s) and cP/1488 = lbm/(ft-sec) are useful conversion factors.
Absolute or dynamic viscosity is commonly referred to as viscosity.
2. Kinematic viscosity, , equal to absolute viscosity divided by density. with the units of centistokes, cSt, or m2/s. Also, cSt*1.076E-5 = ft2/sec.
Why do we care about viscosity?
In general, gas viscosity is used in fluid flow pressure drop calculations, detailed heat exchanger calculations, and droplet settling calculations for separation. It is also used for trouble shooting and equipment sizing.
In this Tip of The Month (TOTM), the variation of viscosity of lean sweet natural gases with temperature, pressure, and relative density (composition) will be presented by a series of charts. These charts can be used to estimate natural gas viscosity for wide ranges of pressure, temperature, and relative density.
Options for estimating gas viscosity
Figures 23 – 22, 23 – 23, and 23 – 24 of the GPSA Engineering Data Book (EDB) [2] present data on the viscosity of hydrocarbon gases. While GPSA EDB presents several options, as an example, only the SI version of GPSA Fig 23 – 23 [2] is shown here.
Example 1 - Estimate the viscosity of a natural gas (0.7 relative density) at 100 °C (212 °F) and 5000 kPa (725 psia) using GPSA Fig 23 – 23.
Answer - from GPSA EDB Fig 23 – 23, µ = 0.015 cP.
GPSA EDB Fig 23 – 23 [2]
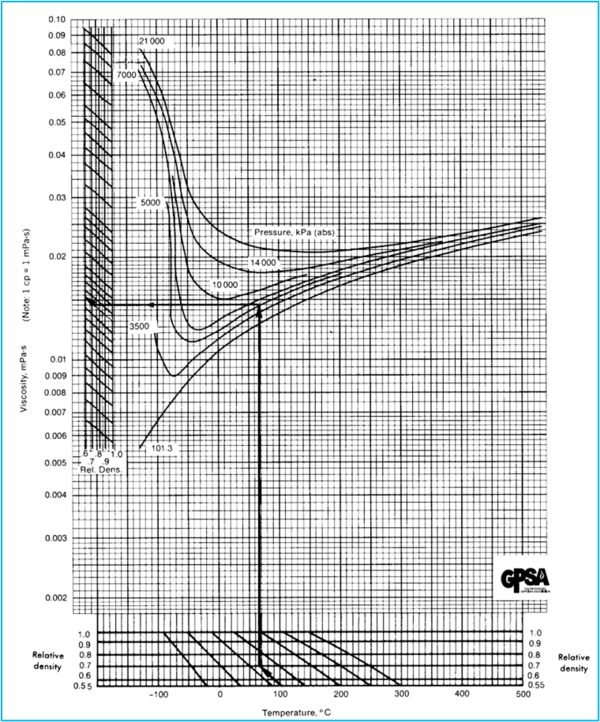
Figure 1. Hydrocarbon Gas Viscosity (GPSA EDB Fig 23 – 23 [2]) SI
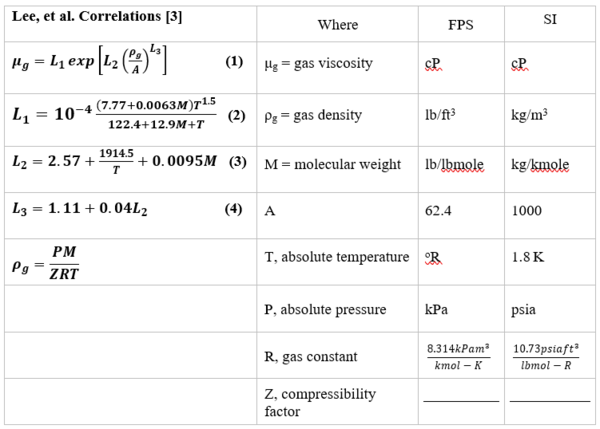
The Lee et al. correlations [3] are also suitable for estimating hydrocarbon gases. Table 1 shows Lee et al. correlations (Equations 1 through 4) along with its nomenclatures. Note, in addition to the system temperature and molecular weight, the gas density, ρg, and system pressure are also required. The Lee et al. correlations are suitable for spreadsheet calculations if they are coupled with the gas compressibility factor that is needed for gas density, ρg, calculation.
Table 1. Lee et al. [3] Correlations (Equations 1 through 4), along with its nomenclatures
Example 2 - Estimate the viscosity of a natural gas (0.7 relative density) at 55 °C (131 °F) and 9898.7 kPag (1435.3psig) using Lee et al. correlations Programed in excel by Wes Wright [4].
Answer - The top region of Table 2 shows the input values in the orange cells and all intermediate calculated values are in the white cells. The calculated viscosity values are in the last two rows (yellow cells) of Table 2. The left segments of Table 2 are in SI units and the right segments are in FPS units.
Table 2. The input values and summary of results for Example 2 by Lee et al. correlations [3].
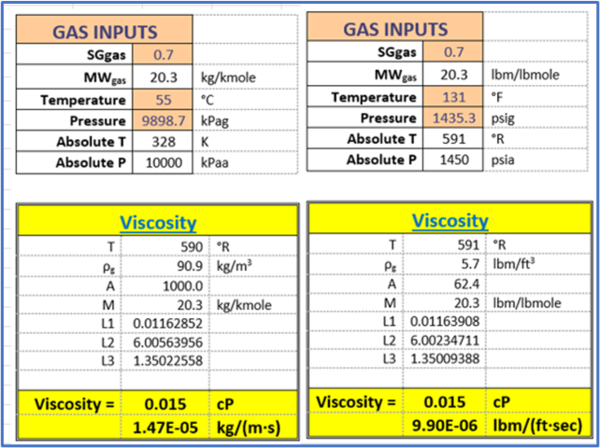
Figure 3.7 in Chapter 3, Volume 1 of Campbell book [1] presents the viscosity of a mixture of hydrocarbons gas (molecular weight of 19.7) as a function of pressure and temperature using the Lee et al. correlations [3].
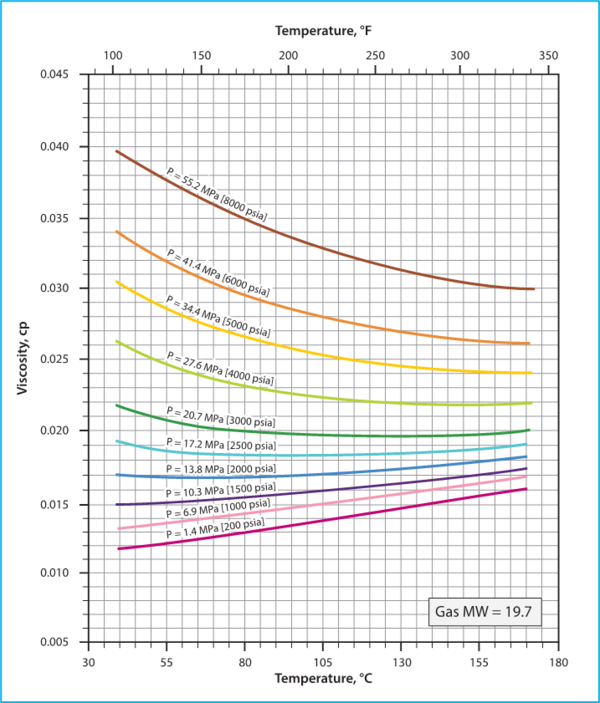
Figure 2. Hydrocarbon Gas Viscosity, (µg), estimated by Lee et al. correlations
(Figure 3.7 in JMC book [1])
Variation of Hydrocarbon Gas Viscosity, (µg) with P, T, SG (relative density)
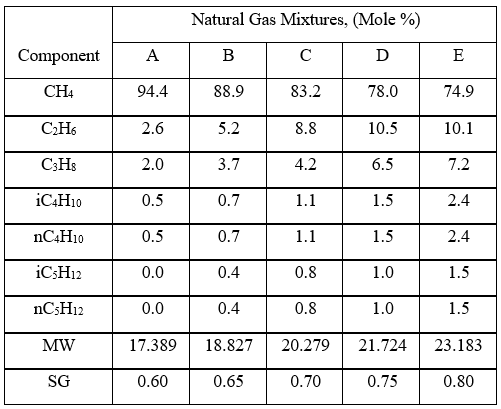
To investigate the effect pressure, temperature, and relative density on hydrocarbon gas viscosity, (µg), we have considered five gas mixtures of A through E, with the compositions, molecular weight, and relative density shown in Table 3. For each gas mixture (SG = 0.6, 0.65, 0.7, 0.75, and 0.8), and a fixed P (0.1, 2, 5, 7, 10, and 20 MPa, or 14.7, 290, 725, 1015, 1450, and 2,900 psia), T was varied 0 to 200 °C (32 to 392 °F) and gas viscosity was calculated by ProMax [5]. Simultaneously, the PR EOS option in ProMax [5] was used to perform vapor-liquid-equilibrium calculation to verify the presence of gas phase and detect the two-phase condition.
Table 3. Gas compositions used for generating ρg values
Let’s demonstrate the steps involved for a single data point by reworking Example 2.
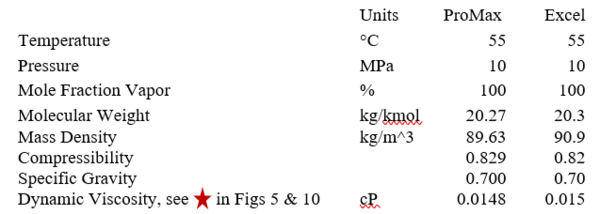
Example 3 - Estimate the viscosity of gas mixture C with the compositions listed in Table 3 (0.7 relative density) at 55 °C (131 °F) and 10,000 kPa (1450 psia) using ProMax [5].
Answer – The summary results for examples 2 and 3 are shown in Table 4. The slight difference in calculated viscosity could be due to the difference in gas density values and round off.
Table 4. ProMax results vs Excel (Lee et al. correlations) results
Figures 3 through 7 present variations of gas viscosity, µg, with pressure, temperature, and gas relative density. Notice in Figures 5, 6, and 7, the gas viscosity is not plotted in the range of 0 to 50 C (32 to 122 F) for intermediate pressures, because two phase (gas and liquid) existed.
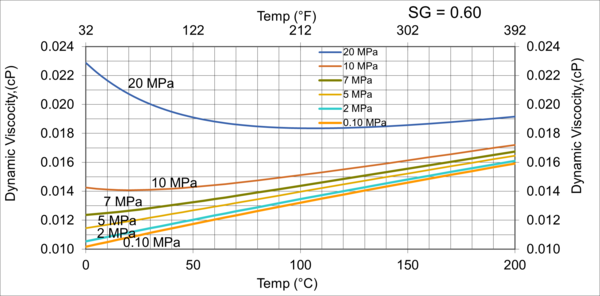
Figures 3 variations of µg with pressure, temperature, for gas relative density of 0.60.
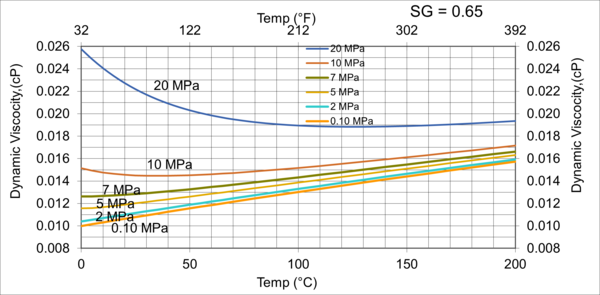
Figure 4 variations of µg with pressure, temperature, for gas relative density of 0.65
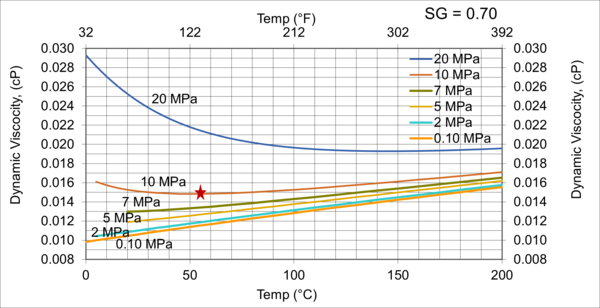
Figure 5. Variations of µg with pressure, temperature, for gas relative density of 0.70
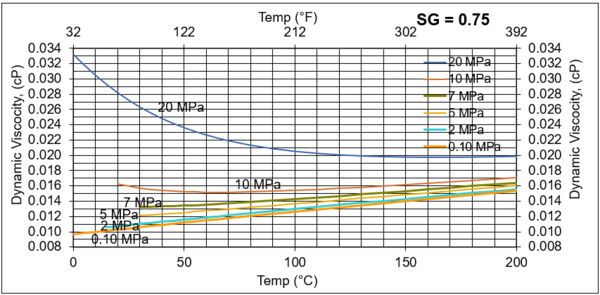
Figures 6. Variations of µg with pressure, temperature, for gas relative density of 0.75
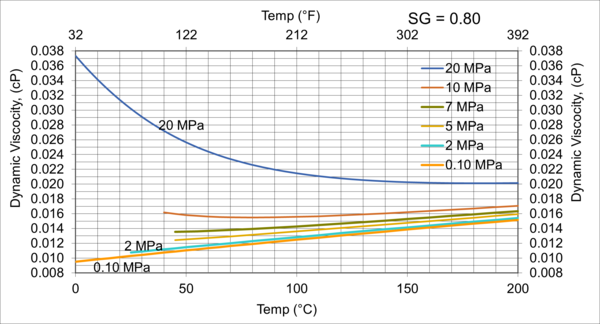
Figure 7. Variations of µg with pressure, temperature, for gas relative density of 0.80
Figures 3 - 7 indicate that for low to moderate pressures of 0.1 to 7 MPa (14.7 to 1015 psia), gas viscosity increases linearly with temperature. But at pressures greater than 7 MPa (1015 psia), like liquids, gas viscosity decreases as the temperature increases. This directionally makes sense. At very high pressures, gas density increases significantly, thus the gas molecules are much closer together and the physical properties exhibited are more “liquid” like.
Figures 8 - 11 indicate that for low to moderate pressures of 0.1 to 7 MPa (14.7 to 1015 psia), the effect of relative density on gas viscosity is small and can be ignored for facilities calculations. But at higher pressures (greater than 7 MPa or 1015 psia), the effect of relative density on gas viscosity is considerable at temperatures below 100 °C (212 °F).
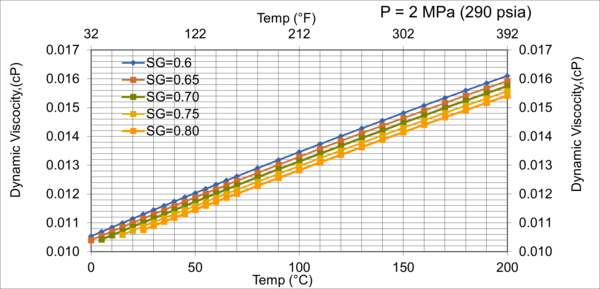
Figure 8. Effect of gas relative density on µg for low pressure of 2MPa (290 psia)
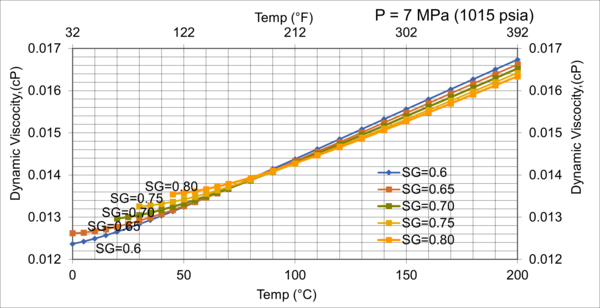
Figure 9. Effect of gas relative density on µg for moderate pressure of 7MPa (1015 psia)
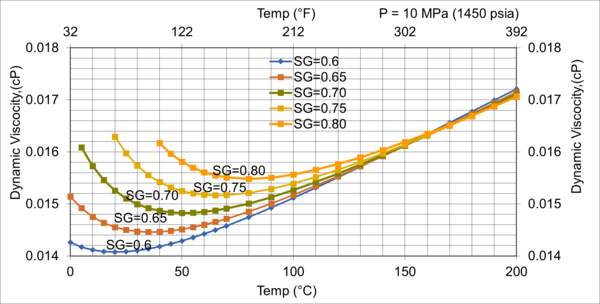
Figure 10. Effect of gas relative density on µg for high pressure of 10MPa (1450 psia)
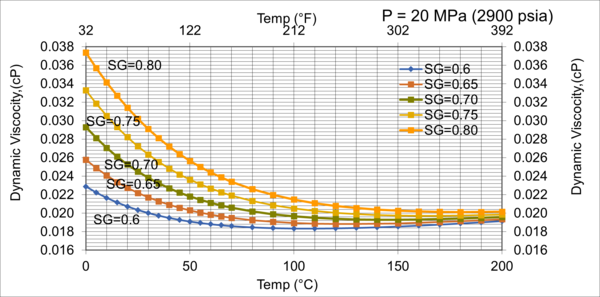
Figure 11. Effect of gas relative density on µg for very high pressure of 20MPa (2900 psia)
Discussion and Conclusions
Several options/methods for estimating viscosity of lean sweet natural (hydrocarbon) gases as a function of pressure, temperature, and relative density (composition) were reviewed. These methods were graphical charts or empirical correlations covering wide ranges of pressure (0.10 to 20 MPa, 14.5 to 2900 Psia), temperature (0 to 200 °C, 32 to 392 °F), and relative density (0.60 to 0.80). Using ProMax a series of generalized charts presented to show the behavior of gas viscosity with pressure, temperature, and relative density (composition) and can be used to determine gas viscosity.
From Figures 3 through 11, the following observation can be seen:
For low to moderate pressures of 0.1 to 7 MPa (14.7 to 1015 psia),
1. Gas viscosity increases linearly with temperature. But at higher pressures greater than 7 MPa (1015 psia), like liquids, gas viscosity decreases as temperature increases.
2. For typical oil and gas processing facilities operating conditions the effect of relative density on gas viscosity is small and can be ignored for facilities calculations. But at pressures greater than 7 MPa (1015 psia), the effect of relative density on gas viscosity is considerable.
3. From reviewing the charts and considering that most facilities are operating in the range of 7 MPa and roughly 38 °C (1015 psia and 100 °F), A good “rule of thumb” for natural gas viscosity at typical facility operating conditions is roughly 0.013 cP.
To learn more about physical properties, consider enrolling in Process Engineering Fundamentals virtual short course.
By: Mahmood Moshfeghian, Ph.D.
References:
2. GPSA, Engineering Data Book, 14th Ed. (2016).
3. Lee, A. L., Gonzalez, M.H., and B.E. Eakin, “The Viscosity of Natural Gases”, J. Pet. Tech. (Aug. 1966) 997-1000; Trans., AIME (1966) 234.
4. Wright, W.H., ‘Fluid properties workbook,” Personal communications, 2018
5. ProMax®, Bryan Research & Engineering Inc, Version 5.0, Bryan, Texas, 2018