Authors: Kindra Snow-McGregor, Mahmood Moshfeghian, Ron Frend, Brian Inglis and Karl Gerdes
Introduction
In continuation of Feb 2023 “Tips of the Month” (TOTM) [1] and given the amount of investment and interest in hydrogen, we have decided to publish a series of TOTM to explore the opportunities, challenges, and potential solutions to hydrogen applications and uses; this is the second paper in the series. As such, we will continue this exploration with hydrogen compression and transportation by transmission pipeline systems – what are the permissible conditions and restrictions? This TOTM does not cover the pipeline materials compatibility issues, which will be a focus of another tip. In terms of the compression characteristics, what are the technical challenges for deployment?
Our future tips will explore the possible end uses and benefits of hydrogen, thermodynamics of natural gas use versus hydrogen in industrial applications, safety considerations, transportation challenges and opportunities, storage, and end use capabilities. In addition, we will look at some cost comparisons, where possible of the different hydrogen production options. We hope you enjoy taking this journey with us. Our aim is to take a thermodynamically balanced non-biased view of possible applications, costs, and implications.
North American Pipeline Tariff
A pipeline tariff is essentially the agreement between the gas producer / processor and the pipeline company that accepts and transports the gas producer / processors treated sales (residue) gas. The agreement outlines many legal requirements, including the rates charged for the pipeline service, maximum and minimum delivery commitments, maximum gas temperature and pressure and so on. The tariff also includes quality specifications for the gas that the pipeline is willing to accept for transport.
It should be noted that depending upon the location of the pipeline, and the pipeline type (gathering, interstate and intrastate) the quality specifications may be different:
Heating Value [2]
This is typically expressed as a minimum higher heating value (HHV), for example HHV should not be below 980 Btu/scf (other pipeline tariff may allow 950 Btu/scf) and may also include a maximum heating value. In some instances, the lower or net heating value (LHV) may be used. The heating value specification is required to ensure safe and stable end use of the natural gas in combustion devices for all pipeline systems transporting treated sales gas (i.e., not gathering system pipelines that move unprocessed natural gas).
Inert Gases
Carbon dioxide (CO2) and nitrogen (N2) do not burn; thus, they have zero heating value. As a result, they take up “space” in a gas pipeline transmission system in that they do not contribute to the heating value of the gas.
CO2 is often specified separately because of its corrosive nature in the presence of water. A maximum of 2 – 3 mol% is typical for large transmission pipeline systems.
Nitrogen may or may not be specified. If it is specified, it is typically in the range of 2 – 3 mol %. If N2 is not specified, then a total Inert specification is used, generally in the range of 3 – 5 mol%.
Water Content:
Transmission pipeline systems are designed to handle liquids-free natural gas. This is primarily for safety purposes: 1. free water in natural gas can form hydrate plugs and plug the pipeline 2. water and CO2 form carbonic acid, which is corrosive, 3. Water may collect at a low point in the line and not be swept out leading to potential fouling and corrosion in that location 4. water will also freeze at temperatures below the freezing point, and 5. Fired equipment do not tolerate free water in the fuel gas stream. As such the water dewpoint for a transmission system is specified based upon ensuring that there will be no water condensing out of the treated gas at the pipelines coldest expected operating temperature for that location.
Hydrocarbon Dewpoint:
Hydrocarbon dewpoint specifications vary with climate and the buyer or transporter of the natural gas. The hydrocarbon dewpoint is the temperature and pressure at which liquid hydrocarbons will start condensing out of the gas. As stated above, pipeline transmission systems are not equipped to handle liquids, and the end user combustion equipment cannot safely burn liquid hydrocarbons. Thus, the hydrocarbon dewpoint is specified to prevent liquid hydrocarbons from condensing out of the treated sales (residue) gas at any pipeline operating condition.
H2 Contaminants [3, 4, 5 and 6]
The contaminants in H2 reflect both the syngas route (Steam Methane Reforming [SMR], Autothermal Reforming [ATR] & Partial Oxidation [POX]) and the H2 purification technology used.
Contaminants to be removed include water, nitrogen, CO2 & carbon monoxide (CO), with fuel cells being the most sensitive to purity issues.
The modern SMR uses Pressure Swing Adsorption (PSA) to achieve a 99.9% purity H2 product. The contaminants being removed are unconverted methane (CH4) along with H2O, CO, and CO2. About 95% of N2 in the feed gas will show up in the PSA tail gas. For refinery or petrochemical applications, carbon oxides are generally a bad thing in that they are catalyst poisons. A total spec on oxygen-containing species of 10 ppm is typical [5]. The same processing can be done for ATR or POX syngas to achieve a very pure H2 product. The recovery of H2 would be lower for syngas stream containing higher fractions of contaminants to be removed.
The pre-1970’s SMRs used solvent scrub downstream of Water Gas Shift (WGS) to reduce CO2 to very low concentration. This was followed by a catalytic methanation step to convert all carbon oxides to CH2. Net result was 97% H2 with the balance CH4.
For H2 to be used as fuel, rather than as a feedstock, the tradeoff is just how much carbon leakage to the fuel use is OK versus capital to remove carbon species. Amines remove the CO2, but not CO and CH4. Typical syngas processing to make H2 uses 2 stages of WGS to bring CO down to 0.2-0.4 mol %. A recent National Energy Technology Laboratory (NETL) study used 3 stage to maximize CO2 capture. Hence, combustion fuel grade H2 (not suitable for fuel cells) may be 95% H2, with the balance made up of CH4, CO, and CO2.
Flame Speed, Flame Temperature, and Nitrogen Oxides (NOX) [7]
According to reference [7], there are three main areas of concern when you blend hydrogen with natural gas (NG).
- Flame speed
a. Hydrogen flame speed is 1.7 m/s (5.6 ft/s) whereas natural gas is only 0.4 m/s (1.3 ft/s). Normally, that means the flame speed of the gas mixture (H2 + NG) will be somewhere between the two so the burner must be able to cope with that while still attaining a thorough mix with the air.
b. Burner designs that utilize lean premix, premix, or rapid premix designs are not suited for a fuel stream that varies in H2 composition. As the composition of H2 increases in the fuel stream, these types of burners become more susceptible to flashback. Flashback occurs when the gas velocity exiting the burner nozzle is slower than the flame speed in a premixed application. Damage to the burner components can result when flashback occurs.
- Flame temperature
a. Hydrogen is 2182 °C (3,960 °F), natural gas 1937 °C (3,519 °F). (Glassman “combustion” 1987). Materials have to be able to stand the higher temperature.
- NOx production
a. The rapid combustion process releases the combustion energy in a small volume, leading to localized elevated near-flame region temperatures, which compound the effect of the inherently high adiabatic flame temperatures on NOX emission rates. Any region with elevated temperatures above 1,371°C (2,500 °F) is conducive to NOX formation. Field and test facility data have shown that standard low-NOX burners firing H2 typically exhibit an increase in NOX emission rates by up to a factor of three.
- CO and CO2 emissions
a. The H2 content in the fuel stream also has a significant impact on CO and CO2 emissions. As H2 replaces hydrocarbons in the fuel composition, the number of carbon atoms decreases. A fuel stream composed of 100% H2 cannot generate CO nor CO2 as a by-product of combustion due to the lack of carbon in the combustion reaction. Therefore, the higher the H2 content of a fuel, the lower the CO and CO2 emissions, but higher NOX emissions. Please reference the stoichiometric combustion reactions below:
Hydrocarbon Combustion: [CH4 + 2(O2 + 3.76N2) = CO2 + 2H2O + 7.52N2] Pure H2 Combustion: [2H2 + (O2 + 3.76N2) = 2H2O + 3.76N2].
The UK ran an experiment blending up to 20 vol% hydrogen into the gas grid, which they have determined is feasible and safe (HyDeploy Project) [9]. The upshot is that, in the short term, the UK experiment of blending up to 20% of hydrogen in the natural gas grid [10] should work but there will be fairly rapid burner failures – especially in domestic applications. For domestic use there is no special method for reducing NOX – only in industrial so we won’t see a change in the short term but long term there would be an impact in atmospheric NOx. Industrial users will have problems maintaining the low NOx emissions as required by regulatory rules.
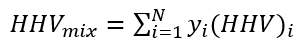
- Heating (Calorific) value
- based on HHV (not LHV)
- typical specifications
- US 950 - 1200 Btu/scf
- Europe 40 - 45 MJ/Nm3
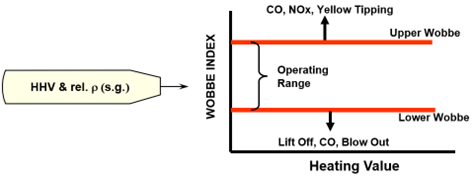
- Wobbe Index
- better measure of interchangeability than heating value
- Impact of rel. density (S.G.): Gas flow through burner tip slows down as the gas gets heavier.

Case Study-Hydrogen blending with natural gas residue as a fuel for heavy industry.
To explore the possibility of blending a relatively pure hydrogen stream with a natural gas residue to supply 5.65x10⁶ SCMD (standard cube meter per day) or 200 MMSCFD fuel gas to a heavy industrial unit. The compositions of both streams are shown in Table 1. With the aim of achieving net zero, the objective is to maximize amount of hydrogen in the fuel gas by replacing hydrocarbons while meeting pipeline tariff and sales specifications.
To determine the impact of volume fraction of hydrogen blending in natural gas stream on the compressor power requirement to reach the discharge pressure of 7,500 kPa (1,087.5 psia), and high heating value of the fuel gas the process flow diagram in Figure 1 was simulated using ProMax version 6.0 [8] with Peng-Robinson EOS (equation of state) option.
The two feed streams of natural gas (NG) and hydrogen (H2) with specified flow rates were blended in the Mix - 100 and then stream 1 is heated by XCHG-100 to adjust its temperature in stream 2 to 12 °C (53.6 °F) before entering the scrubber to remove any condensed liquid before entering the suction nozzle of the centrifugal compressor, CMPR-100, with a polytropic efficiency of 75%. For each run, the heat duty of the heat exchanger and the power requirement for compressor were calculated and presented in Table 2. The blending volume ratio was varied from zero to about 54% by volume. All together 20 runs of simulation were performed, and the results are presented in Table 2.
Table 1 – Composition and conditions of feed streams
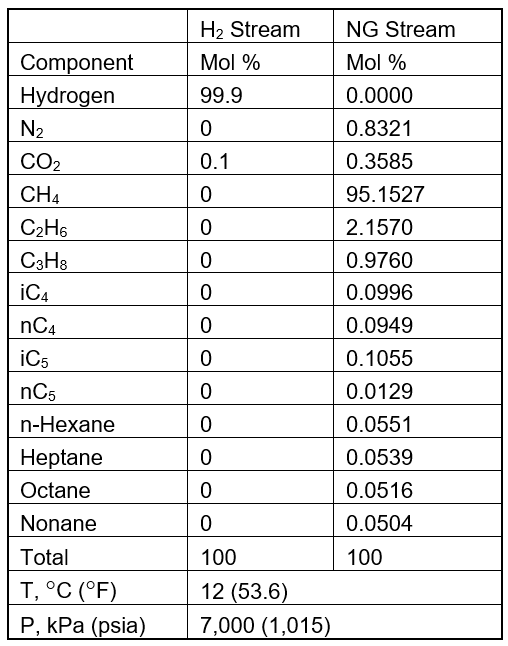
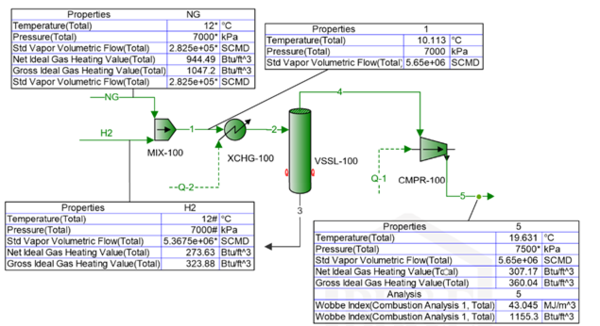
Figure 1 - A simplified process flow diagram for blending and compression of the fuel gas.
Notice, the stream data shown in Figure 1 are for simulation run 20, the last run in Table 2.
Results and Discussion of Results
Tables 2 – International System of Unis (SI) and 2 – Foot, Pound, Second (FPS) units present summary of results for 20 simulation runs. In all 20 runs, the temperature, pressure, and compositions of NG and H2 streams were kept the same as presented in Table 1. Stream 4 temperature, pressure, standard volume rate, and compressor discharge pressure, and polytropic efficiency were kept constant. Notice that while streams H2 and NG standard volume rates were varied, their sum remained the same at 2.00E+08 SCFD (200 MMSCFD) or 5.65E+06 SCMD.
Table 2 – Summary of simulation results for 5.65E+06 SCMD of fuel gas – SI Units
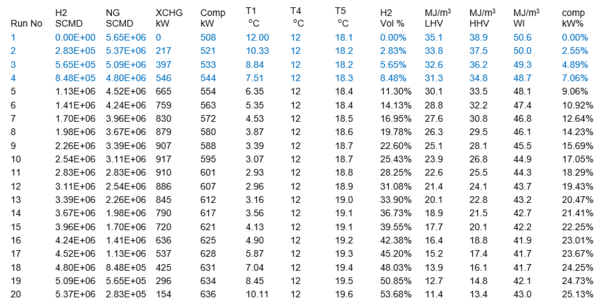
All LHV, HHV, and WI are at ideal gas conditions.
Table 2 – Summary of simulation results for 2.00E+08 SCFD– FPS Units
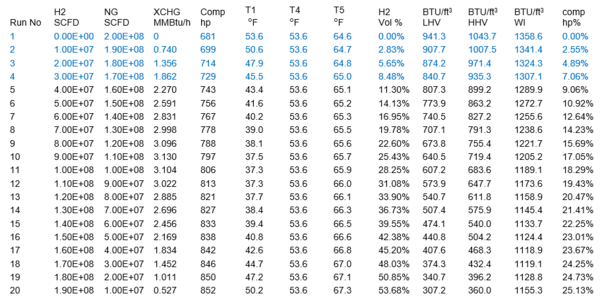
All LHV, HHV, and WI are at ideal gas conditions.
The calculated variables are the XCHG (Heat Exchanger) duty, compressor power, volume % of H2 stream in the fuel gas, compressor power % increase, LHV, HHV, WI (Wobbe Index), and compressor discharge temperature.
Impact of hydrogen blending on compression power
Table 2 and Figure 2 indicate that for the same conditions, at constant feed volume rate of 2.00E+08 SCFD (200 MMSCFD) or 5.65E+06 SCMD, increasing volume fraction H2 stream in total feed, compressor power increases. In other words, replacing methane or other hydrocarbons with hydrogen, compressor power increases.
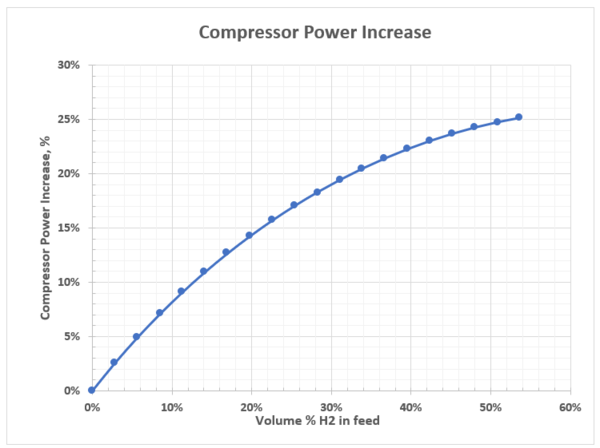
Figure 2– Replacing hydrocarbons with hydrogen, compression power increases.
Conclusions:
Inspection of the summary of results in Table 2 and Figure 2 for the case study, the following observation can be made.
- Only top four runs meet pipeline tariff heating value specifications with a maximum H2 stream blending of less than 8 volume % at the expense of about 7 % increase in compressor power requirement.
- Pipeline companies will need to re-assess their pipeline tariffs regarding natural gas hydrogen blending. This will need to be done considering current pipeline metallurgy and soft goods. The impact of hydrogen blending to end users (for example, power stations, residential, commercial, etc..) will need to be carefully analyzed to ensure safety to the general public. In addition, the heating value of the transported stream will need to be given thought to unsure safety in performance in all end user applications.
- For large volume rate of fuel gas, the centrifugal compressors are the preferred choice. However, the small molecular weight of hydrogen causes reduction of fuel gas molecular weight, and the compressor may not deliver the specified discharge pressure as a result.
- A result of the significant reduction in HHV in the natural gas stream as the hydrogen content increases, coupled with the hydraulic and maximum operating pressure limitations of existing pipeline systems without looping or compressor upgrades, the shift to blended hydrogen natural gas has the net impact of delivering less BTU/hr, which could have a negative impact not only on industrial, commercial and residential consumers.
- Also, the small molecular weight of hydrogen causes reduction of fuel gas molecular weight and specific gravity leading to higher Wobbe Index requiring burner nozzles retrofit.
References:
- Snow-McGregor, K., Frend, R., Inglis, B., Gerdes, K., “Hydrogen Series Part 1: Hydrogen Colors – What do they mean, Options for Production and their associated Challenges?”, PetroSkills Tip of the Month, Feb (2023)
- Nautilus Pipeline Company, L.L.C. 3. Quality, FERC Gas Tariff Version 2.0.0, Second Revised Volume No. 1, March 8, 2019.
- IEA, Reference Data and Supporting Literature Reviews for SMR-Based H2 Production with CCS, March 2017.
- IEA GHG, “Techno-Economic Evaluation of SMR Based Standalone (Merchant) Hydrogen Plant with CCS,” IEAGHG Technical Report 2017-02, Feb 2017.
- DOE/NETL-2022-3241, “Comparison of Commercial, State-of-the-Art, Fossil-based Hydrogen Production Technologies,” April 12, 2022.
- Bacquart, T., et.al., “Hydrogen fuel quality from two main production processes: Steam methane reforming and proton exchange membrane water electrolysis,”, Journal of Power Sources 444 (2019) 227170
- https://cea.org.uk/practical-considerations-for-firing-hydrogen-versus-natural-gas/
- ProMax 6.0, Bryan Research and Engineering, Inc., Bryan, Texas, 2023.
- https://www.chemistryworld.com/news/trial-of-hydrogen-to-heat-uk-homes-and-university-hailed-a-success/4014385.article
- https://www.spglobal.com/commodityinsights/en/market-insights/latest-news/electric-power/011422-uks-gas-grid-ready-for-20-hydrogen-blend-from-2023-network-companies