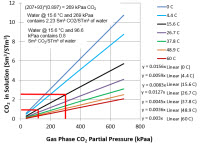
Why CO2 Flashing from Water is Important for CO2 EOR Flood Separators and Tanks
February 12, 2015
|
Tip of the Month
In this Tip of the Month (TOTM) we will discuss how to determine CO2 solubility and flashing issues in water at pressures and temperatures commonly associated with gathering systems and production facilities. This is mainly important for CO2 Enhanced Oil Recovery (EOR) floods as the CO2 concentration is high and the initial separation is at higher...
View Article

Variation of Crude Oil Properties with Temperature in a Gathering Line
January 21, 2015
|
Tip of the Month
In the October and November 2014 Tips of the Month (TOTM), we demonstrated that Gas-Oil-Ratio (GOR) has a large impact on the capacity of crude oil gathering lines. If GOR is less than the saturation solution gas, the increase in GOR reduces the viscosity and density of crude oil which causes the pressure drop to decrease. However, if the GOR excee...
View Article

Impact of Solution Gas on Crude Oil Properties in a Gathering Line
November 4, 2014
|
Facilities Topics
In the October 2014 Tip of the Month (TOTM), we demonstrated that Gas-Oil-Ratio (GOR) has a large impact on the capacity of crude oil gathering lines. In general as GOR increased the pressure drop increased which lowered the line capacity. In addition, at high pressures and low GOR, pressure drop was lower than the pressure drop for dead oil (solut...
View Article

Impact of Gas-Oil Ratio (GOR) on Crude Oil Pressure Drop in Gathering Systems
October 7, 2014
|
Tip of the Month
In the June 2008 Tip of the Month (TOTM), we demonstrated how general-purpose process simulation programs can be used to simulate gas dominated two-phase pipelines. In the August 2008 TOTM, we discussed the value of the simple Flanigan correlation and how it can be used to model and analyze the behavior of a wet gas transmission pipeline. The resul...
View Article
Lean Sweet Natural Gas Water Content Correlation
September 3, 2014
|
Tip of the Month
In the October, November, December 2007 and February 2014 Tips of the Month (TOTM), we studied in detail the water phase behaviors of sweet and sour natural gases and acid gas systems. We also evaluated the accuracy of different methods for estimating the water content of sour natural gas and acid gas systems.
The water vapor content of natural ga...
View Article

Simple Equations to Approximate Changes to the Properties of Crude Oil with Changing Temperature
April 22, 2014
|
Tip of the Month
This article describes simple equations to approximate changes to the properties of crude oil with changing temperature. Changes in crude oil density and specific heat, or heat capacity, can be estimated from graphs and/or more elaborate computer simulation. The latter generally requires access to a process simulator and characterization data fo...
View Article